EngageNY
Describing Distributions Using the Mean and MAD
What city has the most consistent temperatures? Pupils use the mean and mean absolute deviation to describe various data sets including the average temperature in several cities. The 10th lesson in the 22-part series asks learners to...
Curated OER
Household Conservation/Efficiency
Hook your class up to an online home energy usage calculator so that they can estimate the amount used per month by their families. Then give them Watt meters with which they will measure the power consumption of several small...
Illustrative Mathematics
Stained Glass
A complex question looking for the total cost of a stained glass window by calculating area and circumference of a circle. With detailed components, this activity will challenge your designers to figure out if they have enough money to...
Statistics Education Web
NFL Quarterback Salaries
Use statistics to decide if NFL quarterbacks earn their salaries! Learners study correlation coefficients after using technology to calculate regression equations. Through the data, they learn the meaning of correlation and correlation...
Curated OER
Unit V: Worksheet 2 - Constant Force
Physics learners studying force and acceleration practice solving eight problems with this assignment. They calculate acceleration and deceleration, net force, and distances required for stopping a moving object. Kinematics equations and...
Curated OER
Unit VII: Worksheet 4 - Energy
Energize your physics class with this energy exercise! Physics learners solve seven problems in which they calculate speed, velocity, or energy values for a variety of situations. This is a suitable homework assignment for high school...
PBS
A Little Recycling Goes A Long Way
Every time you purchase something from the store, it goes into a bag, but what happens to the bag? This lesson encourages your learners to think about what happens to those plastic and paper bags and their effect on the environment. Use...
Bismarck Public Schools
History & Math of the 1830s
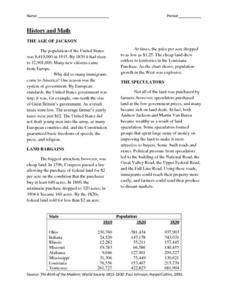
Using this interdisciplinary learning exercise, your young historians will have the opportunity to practice their math skills while learning about the drastic population increase in the United States during the presidency of Andrew...
Wild BC
Greenhouse Gas Line-Up
Discuss different sources of energy and how much greenhouse gas each might emit. The six sources are then ranked according to emissions from greatest to least. Finally, the true cumulative emissions are revealed to show the class how...
North Syracuse Central School District
Nutrition Label Worksheet
Nutritional labels are everywhere, yet so few of us take the time to use them! Here is a worksheet that learners can use to practice calculating such features as calories, carbohydrates, and serving size based on real examples of...
Mr. E. Science
Motion
An informative presentation covers motion, metric system, conversions, graphing of coordinates and lines, speed, velocity, and acceleration problems, as well as mean calculations. This is the first lesson in a 26-part series.
EngageNY
Games of Chance and Expected Value 2
Use expected values to analyze games of chance. The 15th installment of a 21-part module has young mathematicians looking at different games involving tickets and deciding which would be the best to play. They calculate expected payoffs...
EngageNY
Graphs of Simple Nonlinear Functions
Time to move on to nonlinear functions. Scholars create input/output tables and use these to graph simple nonlinear functions. They calculate rates of change to distinguish between linear and nonlinear functions.
University of Colorado
Planetary Distances on the Playground
Earth is 149,600,000 km, or 92,957,130.4 miles, from the sun. Young astronauts create an interactive model to learn the distances between planets. Nine groups, each representing a different planet, are spread around at class-calculated...
Curated OER
Applications of the Pythagorean Theorem - Magnetism
Middle and high schoolers use the Pythagorean Theorem to complete a table showing with the magnetic field strengths in given cities. They find the average value of the Earth's magnetic field and plot one of the three-dimensional values...
Curated OER
Speed Problems
Return to the classic word problem with these speed scenarios. Learners use some combination of the variables speed, distance, and speed to solve six problems, all of which ask for one of these as an answer. The examples do a nice job of...
Physics Classroom
From a Feather to an Elephant
It is always a rush to drop objects from great heights, and with this physics experiment, class members will not be disappointed! They drop a single coffee filter from a balcony or table top, record the time it takes to reach the ground,...
Illustrative Mathematics
Giantburgers
What is a million between friends? This fast food chain claims to serves a certain percentage of Americans every day. The resource agrees, but depending on how you calculate it, you could be a million off. Let your fast food munchers be...
Curated OER
Rising Gas Prices – Compounding and Inflation
Financial literacy skills and exponential models are connected by the compound interest formula in this task centered on inflation calculations. Collaborative learners get experience collecting data from the given websites and exploring...
Chymist
Alum from Waste Aluminum Cans
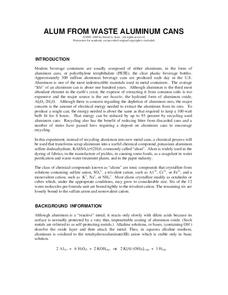
Turn aluminum cans into pickles! An engaging experiment has learners chemically change aluminum into a substance with many purposes including the manufacture of pickles. After performing the chemical conversion, the experimenters verify...
CCSS Math Activities
Satellite
This isn't rocket science, you know. A performance task has learners use right triangle trigonometry to calculate distances from stations on Earth to a satellite. It also requires finding the distance between two stations along the...
Curated OER
View Tube Triangulation
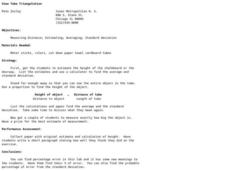
Students investigate a particular object then calculate to find the class average and standard deviation. In this measuring distance lesson students list their calculations on a piece of paper.
Curated OER
Central Tendencies and Normal Distribution Curve
Fourth graders are given data (class test scores) to determine central tendencies, and find information needed to construct a normal distribution curve. They become proficient in calculating mode, median and average.
Curated OER
Data Analysis
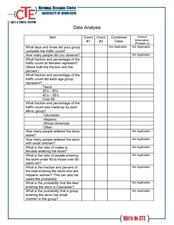
In this data analysis worksheet, students complete several activities to analyze data. Students calculate the mean, median, mode, and range for the 14 problems.


