Curated OER
What is Motion?
In this motion worksheet, students will write in motion vocabulary words including velocity and speed to complete 7 statements. Then students will calculate average speed and velocity in three short answer questions.
Curated OER
Average Looking
Students use measurements of their classmates to find the average (means and modes) of their facial features. They use their findings to create a three-dimensional "class head." Examples and assessment materials are included.
Curated OER
Instantaneous Rate of Change of a Function
Pupils draw the graph of a door opening and closing over time. They graph a given function on their calculators, create a table of values and interpret the results by telling if the door is opening or closing and evaluate the average...
Curated OER
How Big is Barbie?
Students measure various dimensions of a male and a female dolls body and scale them proportionally to average human measurements. They calculate the appropriate scale factor (magnitude) to enlarge their doll and apply that scale factor...
Curated OER
Tracking Speed
Young scholars calculate the speed of an object, by measuring the amount of time it takes to cover a given distance, and then divide: speed=distance/time. However, the object may not have been moving at a constant rate over the given...
EngageNY
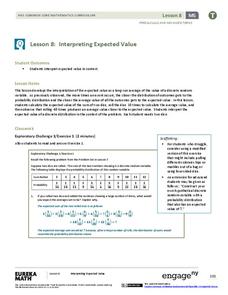
Interpreting Expected Value
Investigate expected value as a long-run average. The eighth installment of a 21-part module has scholars rolling pairs of dice to determine the average sum. They find aggregate data by working in groups and interpret expected value as...
Curated OER
Perimeters: Which Constellation is the Longest?
High schoolers use diagrams of the constellation Orion and the constellation Ursa Major which show the distances between the stars of the constellations. They calculate the perimeters of each, find the average distance of the stars for...
It's About Time
The Changing Geography of Your Community
Lead your class in exploring their local communities as well as the general environment. As they determine continental distributions by investigating minerals, rocks, and fossils located in their local region, pupils construct...
Illustrative Mathematics
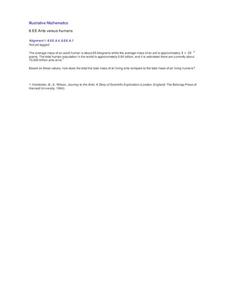
Ants Versus Humans
You would think that humans make up more mass than ants do on this planet, but think again, and this time by performing calculations. Middle schoolers use scientific notation to compute and compare the estimated total mass of all humans...
It's About Time
Factors Affecting Population Size
How do we predict future population growth? Young researchers investigate various factors affecting the size of our population. As they calculate and interpret graphs to determine factors that could potentially affect increases...
Teach Engineering
Measuring Surface Tension
How do you measure surface tension? The fifth installment of a nine-part series is an experiment where young scientists use tubes of different sizes to measure surface tension. They calculate the average and standard deviation of the...
PBS
What We Do Adds Up
With so many tons of trash going into landfills each year, your environmentalists can calculate how much the average person is tossing away. This activity has a series of questions not only requiring math, but a conscious thought of how...
EngageNY
Euler’s Number, e
Scholars model the height of water in a container with an exponential function and apply average rates of change to this function. The main attraction of the lesson is the discovery of Euler's number.
Texas Instruments
Finding Linear Models Part III
Explore linear functions! In this Algebra I lesson, mathematicians graph data in a scatter plot and use a graphing calculator to find a linear regression and/or a median-median line. They use the model to make predictions.
Mathematics Assessment Project
Suzi's Company
Don't use an average resource ... use this one. As a middle school assessment task, learners first determine mean, median, and mode of salaries given in a frequency table. They then investigate how a change in one value changes the...
Inside Mathematics
Suzi's Company
The mean might not always be the best representation of the average. The assessment task has individuals determine the measures of center for the salaries of a company. They determine which of the three would be the best representation...
Inside Mathematics
Population
Population density, it is not all that it is plotted to be. Pupils analyze a scatter plot of population versus area for some of the states in the US. The class members respond to eight questions about the graph, specific points and...
EngageNY
Games of Chance and Expected Value 1
There's a strong chance that class members enjoy learning math through engaging games. Scholars analyze games of chance to determine long-term behavior. They learn to calculate expected value to help with this assessment.
Concord Consortium
Rule of 72
Find an easier way to double it. Using the price of an item and the Consumer Price Index, learners determine how long it will be for the price to double. Scholars calculate the length of time it would take for the price to double using a...
Curated OER
Bird and Dog Race
Your pupil's pet dog and bird are racing down the city streets. In order to know who is going to win, they better know something about calculating rates, the Pythagorean Theorem, and applying those topics to the map of the city.
Curated OER
Basketball Rebounds
Your young basketball players will build a table and develop a general formula for a decaying exponential scenario involving the rebound distance of a bouncing ball. Using a CBR and graphing calculator can make this even more hands-on...
Bowland
110 Years On
How many great, great grandchildren can one have? Scholars estimate the number of descendants a woman can have after 110 years. They use information about the average number of children per family and life expectancy to make this estimate.
McGraw Hill
Lesson 12: Absolute Mean Deviation
Learn a different way to determine variability. An informative lesson provides directions on how to calculate the mean absolute deviation of a data set. Pupils use examples to learn the process and then practice finding the mean absolute...
Learning Games Lab
Cattle Feeding
Finding a balance between too much protein and not enough doesn't have to be a guessing game. Young scientists use an interactive lesson to learn how to calculate protein content in cattle feed and how to mix feed to create the ideal...


