Curated OER
Home Sales Records
Teach your class how to calculate monthly payments on a home mortgage. In this percent lesson, students calculate the monthly payment on a home mortgage, and compare different lengths of time and the interest rates for national median...
Curated OER
Connecting Factors and Zeros
In this Algebra II activity, learners explore the connection between the factored form of a quadratics and the zero of a function. Students use a graphing calculator to verify factoring numerically and graphically.
Curated OER
Counting Chart
Elementary learners discover counting through a counting chart. In this math lesson, students identify numbers 1-100. They then point or recite their counting numbers.
Curated OER
Filling The Urn
Learners calculate the area under a curve. In this calculus lesson plan,students calculate the area by integrating the equation. They calculate the volume of cylindrical shapes created between graphs.
Curated OER
Points on a Line
How do you find slope? You use points on a line of course. slope. Teach your class how to calculate and differentiate between horizontal and vertical lines. They are sure to be pros at graphing lines on a coordinate plane by the end of...
Curated OER
Matrix Transformations
Students perform reflections of polygons. In this algebra instructional activity, students use matrices to calculate the reflection across the x and y axis. They also calculate rotation representing 90 and 180 degrees around the origin...
Curated OER
Areas of Polygons
Young mathematicians calculate the area of polygons in this algebra lesson. They find the determinant as they calculate the areas for triangles and quadrilaterals. They also use scalar multiplication to find the determinant.
Curated OER
Nutrients by the Numbers
Students read and discuss an article on the amount of sugar in various food products. They compare the nutritional values of food products, calculate their daily intake of nutrients, analyze serving sizes, and compare/contrast their own...
Curated OER
Epidemic Proportions
Students research epidemics that have devastated world population at various points in history. They share and calculate statistics obtained in their research and develop graphs comparing and contrasting how different epidemics affect...
Curated OER
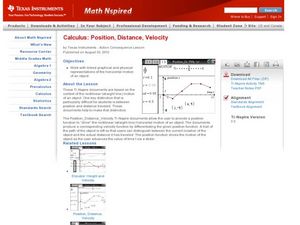
Position, Distance, Velocity
Learners calculate the position, distance and velocity using functions in this calculus lesson. They investigate horizontal motion through the derivative of functions and use the TI to create a visual of their function.
Curated OER
Triangle Midsegment
Learn how to calculate the length and midsegments of triangles. Students differentiate between similar and congruent triangles. They create a spreadsheet with their findings.
Curated OER
Sum of Exterior Angles of Polygons
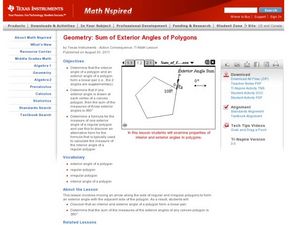
Have fun calculating angles for different polygons. The class differentiate the relationship between the interior and exterior angles of polygons. They discuss linear pair as it related the polygons and their angles. This is done as they...
Curated OER
Discriminant Testing
The class works to identify solutions using the discriminant.They use part of the quadratic formula to find the number of solutions a quadratic equation will have. They calculate how-many times the quadratic function will cut the x-axis....
Curated OER
The Price of Relief
Learners calculate and graph the costs of essential items needed in Kosovar refugee camps on an individual, family, and camp basis. Additionally, students explore how relief organizations and businesses participate in relief efforts.
Curated OER
Shedding Light on the Weather with Relative Humidity
Learners study weather using a graphing calculator in this instructional activity. They collect data for temperature and relative humidity for every hour over a day from the newspaper, then place the data in their handheld calculator and...
Curated OER
Falling Objects
High schoolers examine the velocities of two different falling objects. They produce distance vs. time and velocity vs. time graphs using a Motion Detector and a CBL 2 to collect experimental data. Learners analyze and interpret the...
Texas Instruments
REAL LIFE REAL WORLD Activity - Surveyor
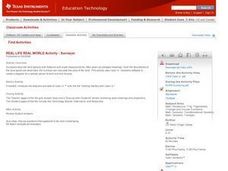
Learners investigate surveying in this secondary mathematics lesson. They will explore a real world application of geometry and trigonometry as they create a plot plan using a geometry utility and calculate the area of the land parcel.
Curated OER
Scale Factor Area Perimeter
Mathematicians compare triangles at different scales. In this geometry activity, learners calculate the area and perimeter of triangles. They use the Ti to make observation of the change that takes place as the triangles are dilated.
Curated OER
The Geometry of Circles
Young scholars review the parts of a circle, calculate the circumference and area of a circle, and create student-made tests on the geometry of circles using educational software.
Curated OER
Order of Operations
Seventh graders investigate the order of operations. For this seventh grade mathematics lesson, 7th graders explore the order of operations and practice using them in activities that involve paper and pencil, calculators and...
Center of Excellence for Science and Mathematics Education
A Sick Astronaut
Aspiring astronauts graph, interpret, and analyze data. They investigate the relationship between two variables in a problem situation. Using both graphic and symbolic representations they will grasp the concept of line of best fit to...
Curated OER
Punnett Squares
Eighth graders take a short quiz on genotypes and phenotypes. As a class, they are introduced to the concept of Punnett Squares and listen to a description of Gregor Mendel's pea experiment. In groups, they complete Punnett Squares to...
Curated OER
I'm Warm Now
Third graders graph how much water is wasted while waiting for it to get warm in the spigot in the sink. For this graphing lesson plan, student first predict how much water is wasted. That night they test it out at home and the next day...
Curated OER
Beans and Genes/Genetic Probability
Students use 2 sets of colored beans to represent the genes of an organism. In this genetic probability lesson plan, students use the colored beans to represent the genotypes of offspring which they pull out of a box at random while the...


