EngageNY
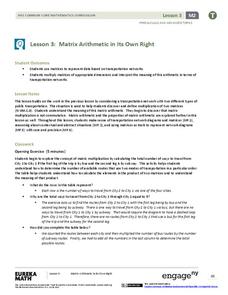
Matrix Arithmetic in Its Own Right
Matrix multiplication can seem random to pupils. Here's a instructional activity that uses a real-life example situation to reinforce the purpose of matrix multiplication. Learners discover how to multiply matrices and relate the process...
National Research Center for Career and Technical Education
Break-Even Point
How do companies determine the prices of their products? Marketing maestros discover the concepts of cost and break-even point through discussion, independent practice, and a collaborative assessment. The career and technology-oriented...
Curated OER
Populations Lab - Cultures Lesson: Statistics / Sampling Patterns
Ninth graders examine the application of statistical sampling, data collection, analysis, and representation that exists in schooling and teenage lifestyles in Japan and the United States.
BW Walch
Creating and Graphing Linear Equations in Two Variables
This detailed presentation starts with a review of using key components to graph a line. It then quickly moves into new territory of taking these important parts and teasing them out of a word problem. Special care is...
Chemistry Collective
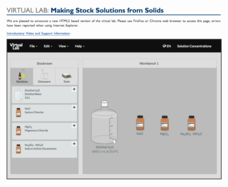
Virtual Lab: Making Stock Solutions from Solids
Combine a little solid and a little water and the solution is clear! An experimental lesson has individuals make calculations to create a sample solution of a given volume and molarity. They then create the solutions using a virtual lab...
Chemistry Collective
Virtual Lab: Coffee Problem
Would you like milk with that? Young scientists consider thermal energy transfer to create the perfect cup of coffee. They calculate the amount of milk needed to reach a specified temperature and then test their calculations using a...
CK-12 Foundation
Expected Value: Creating a Discrete Probability Distribution Table
Wanna roll the dice? Determine whether it is a good idea to play a dice game. An interactive presents the rules for a game of dice. Pupils find the probabilities of each event and calculate the expected value of the game. They finish...
Las Cumbres Observatory
The Cosmic Distance Ladder: Parallax
Scientists don't have a ruler long enough to measure to the stars, so they rely on math. Scholars learn to calculate the distance from Earth to a star using the parallax method. They use angle measures from different perspectives to...
NASA
Just How Far is That Star?
Pupils often wonder how we know the distance to various stars. Starting with a thought experiment and progressing to a physical experiment, they determine the brightness and distance to various stars. The evaluation requires...
Howard Hughes Medical Institute
What is My Carbon Footprint?
Here is a lesson that walks youth through an online carbon footprint calculator produced by the University of California, Berkeley. Once learners finish inputting information, they compete a worksheet with the results. This is simple,...
University of Wisconsin
Follow the Drop
Young surveyors look for patterns in water flow around campus. Using a map of the school (that you will need to create), they mark the direction of the path of water. They also perform calculations for the volume that becomes runoff. The...
Math Worksheets Land
Patterns of Association (Using Data Tables) - Guided Lesson
The instructional activity belongs to a four-part resource that applies percentages to data tables. The page has three practice problems that continues with the development of this topic.
Physics Classroom
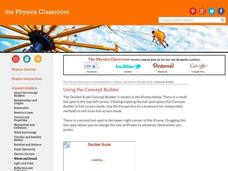
Decibel Scale
Turn it up! Sound scientists explore the decibel scale through an interactive that calculates movement up and down the scale. Part of a series of interactives that explore sounds and waves, the resource includes a help feature to support...
101 Questions
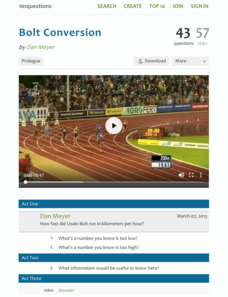
Bolt Conversion
Usain Bolt and Superman have something in common—speed! A video of one of Bolt's races introduces young scholars to the concept of unit rate. Using data from the race, the narrator calculates a unit rate in kilometers per hour, which...
Concord Consortium
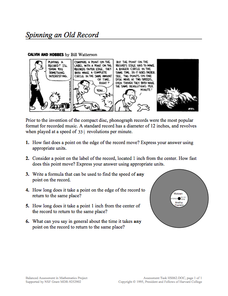
Spinning an Old Record
Take a trip back in time to examine angular velocity. Using the revolutions per minute, learners calculate the speed of a point on a 33 record. They compare the speed of a point on the edge of the record to the speed of a point closer to...
Learning Games Lab
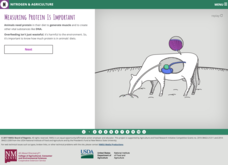
Nitrogen in Feed
Knowing what farmers are feeding livestock is just smart business. A WebQuest lesson helps learners build an understanding of the relationship between amino acids, nitrogen, and protein. With interactive instruction,...
Corbett Maths
Increasing or Decreasing by a Fraction of a Quantity
Calculate fractional changes in numbers. Pupils watch a short video on determining the cost of a shirt after it has been reduced by a fractional amount. Scholars use worksheets to practice calculating increased and decreased amounts.
Flipped Math
Graphing Polynomial Functions
Take a look in the window. Pupils watch a presentation to discover how to graph a polynomial using a graphing calculator and using the window to find the extrema. Scholars use their knowledge from previous lessons to gain a rough idea of...
Illustrative Mathematics
Electoral College
A cross-curricular resource that takes the electoral votes and allows your learners to organize and analyze the data. Young voters can determine which states are more influential and interpret the dotplot provided for more data....
Illustrative Mathematics
Tossing Cylinders
Everyone loves a lesson that involves throwing things around! To understand probability, your experimenters will predict how different cylinder-shaped objects will land when tossed. When the data is collected, they will calculate the...
Illustrative Mathematics
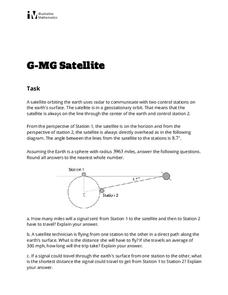
Satellite
Learners practice relating rules of trigonometry and properties of circles. With a few simplifying assumptions such as a perfectly round earth, young mathematicians calculate the lengths of various paths between satellite and...
CK-12 Foundation
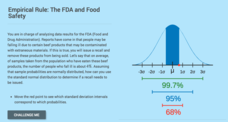
Computing Probabilities for the Standard Normal Distribution: The FDA and Food Safety
To recall or not to recall, that is the question. Using provided data, pupils calculate the percent of people that may fall ill on average. The scholars determine the standard deviation based upon the mean and the empirical rule,...
Howard Hughes Medical Institute
Spreadsheet Tutorial 4: t-Test
The t-test tutorial will fit your needs to a T. After calculating the mean, sum of squares, standard deviation, and variance of two data sets on a spreadsheet, scholars learn to calculate the t-values. They then learn to use the TTEST...
Bonneville
Biolite - Fire to Phone Charging
Provide the spark to foster a love of science. Instructors perform a demonstration that uses a camping stove to generate electricity to charge a phone. Pupils use data from the experiment to the calculate the efficiency of the stove....
