EngageNY
Using Linear Models in a Data Context
Practice using linear models to answer a question of interest. The 12th installment of a 16-part module combines many of the skills from previous lessons. It has scholars draw scatter plots and trend lines, develop linear models, and...
Balanced Assessment
Fermi Estimates I
Enrico Fermi, the physicist responsible for the first nuclear detonation, was known for his ability to estimate with little or no data. Use this task to have your classes practice their Fermi skills. They estimate the magnitude of three...
EngageNY
Why Worry About Sampling Variability?
Are the means the same or not? Groups create samples from a bag of numbers and calculate the sample means. Using the sample means as an estimate for the population mean, scholars try to determine whether the difference is real or not.
PBL Pathways
Boogie Boards
Solve a complex business puzzle by building a linear programming model. An engaging project-based learning problem has classes examining transportation costs and manufacturing limitations from several plants. Ultimately, they use their...
EngageNY
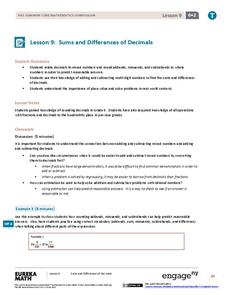
Sums and Differences of Decimals
Sometimes dealing with decimals is so much easier than dealing with fractions. The ninth lesson plan in a 21-part module has the class consider situations when it might be easier to add or subtract fractions by first converting to...
California Education Partners
Animals of Rhomaar
Investigate the growth rates of alien animals. Pupils study fictional animals from another planet to determine how much they grow per year. The investigators plot the growth of their animals over a period of time and then compare...
American Chemical Society
Exothermic, Endothermic, and Chemical Change
Scientists can't observe bonds breaking or forming, so how do they distinguish between exothermic and endothermic reactions? Young scholars complete two experiments to do just that. They monitor temperature change and calculate the...
Shodor Education Foundation
Overlapping Gaussians
Adjust the overlap to compare probabilities. Using sliders, learners adjust the shape of two Gaussian curves. The interactive calculates the area of the left tail for one curve and the right tail for the other. Pupils set the interactive...
101 Questions
Thanksgiving Taters
What would a meal be without the taters? The question is, how long does it take to peel those potatoes? Given the rate of peeling one potato, scholars predict the time it takes to peel the bag. The twist is that the first potato was...
Concord Consortium
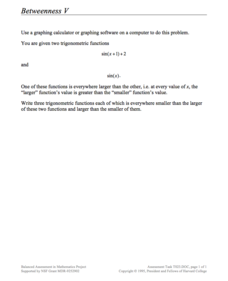
Betweenness V
Take a unique approach to study the graphing of trigonometric functions. Young scholars consider two sine functions and write three functions that will lie between the two given. They use a graphing utility to assist in their explorations.
Curated OER
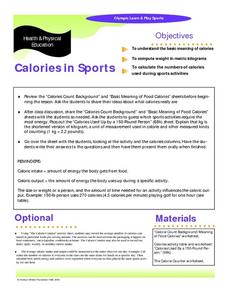
Calories in Sports
This 4-page worksheet includes information on caloric intake and output, an activity/calorie chart, and a form for calculating the amount of calories in various foods. A good introduction to calories.
Curated OER
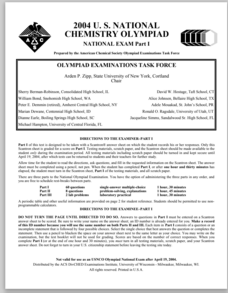
2004 U.S. National Chemistry Olympiad Part I
In this chemistry worksheet, test takers answer 60 multiple choice questions on topics related to chemistry from balancing equations to calculating moles and molecules of compounds. They name formulas, they convert, they solve problems...
Curated OER
Multiplying Polynomials
Learners investigate polynomials. In this algebra instructional activity, students solve problems dealing with multiplication of polynomials by using the distributive property and the FOIL method. Learners...
Curated OER
Dividing
Cement division facts with these drills which include finding remainders and long division. Learners begin by solving 15 horizontally aligned division equations, most of which have remainders. The dividends for this section are all...
Curated OER
Dividing
What happens when a number doesn't divide evenly? Introduce scholars to remainders as they practice with these division problems. First, they answer 15 horizontally aligned equations, many of which include remainders. Next, they complete...
Illustrative Mathematics
Harvesting the Fields
This problem involving rates may look simple at first, but it is actually quite challenging. Two different sized fields are harvested by a team of workers and learners must use different rates to calculate the number of workers on the...
Illustrative Mathematics
Traffic Jam
How many cars would be involved in a traffic jam 12 miles long? A slightly ambiguous writing prompt gives learners the opportunity to practice making reasonable assumptions to tackle a real-life problem. Few details are given, so they...
Curated OER
Writing Linear Equations in Different Forms
Can your class write linear equations three different ways? Here is a study guide that includes slope-intercept, standard, and point-slope forms. Learners are given the slope and a point on the line, or two points and are asked to write...
Curated OER
Basketball Bounces, Assessment Variation 2
This un-scaffold summative assessment tasks learners to use the height of a bouncing basketball, given the data in graph and table form, to choose the model that is represented. Learners then use the model to answer questions about...
Curated OER
Building a Quadratic Function Form
Comparing the movement of graphs geometrically when small changes are made to the parent function motivates this collaborative discussion on the transformations of functions to their various forms. Vertical and horizontal shifts due to...
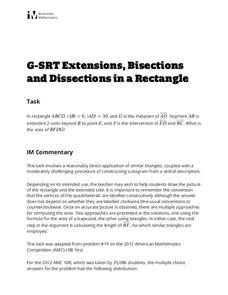
Illustrative Mathematics
Extensions, Bisections and Dissections in a Rectangle
Gaining practice in translating a verbal description into a diagram and then an equation is the real point of this similar triangles exercise. Once the diagram is drawn, multiple methods are provided to reach the conclusion. An effective...
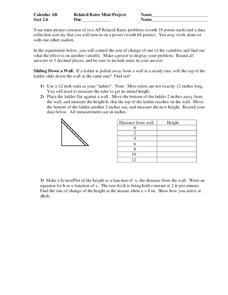
Houston Area Calculus Teachers
Related Rates
Use a hands-on approach to exploring the concepts of related rates in your AP Calculus class. Individuals explore the effect of the rate of change on a variable related to a variable they control. After analyzing the data they...
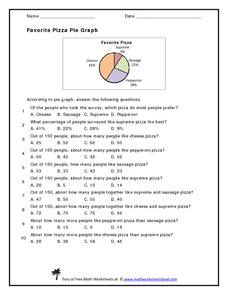
Math Worksheets Land
Favorite Pizza Pie Graph
You've heard of a pie graph, but what about a pizza pie graph? Challenge young mathematicians to answer ten questions based on a random survey of people's favorite pizzas. A pie graph displays the percentages of each type of pizza. Some...
Mt. San Antonio Collage
Quiz 1: Functions, Domain and Range
Take the work out of worksheets and use these problems and worked-out answer key as a resource. The problems reinforce skills in domain and range, identifying graphs, and even and odd functions.
Other popular searches
- Graphing Calculator Skills
- Calculator Skills Memory
- Calculator Skills Ti84
- Calculator Skills Code Words


