Curated OER
Button Bonanza
Collections of data represented in stem and leaf plots are organized by young statisticians as they embark some math engaging activities.
Curated OER
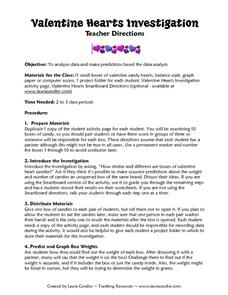
Valentine Hearts Investigation
Students practice analyzing data and making predictions. In this 2nd - 3rd grade lesson plan, students investigate and compare data gathered using boxes of valentine candy hearts. Students examine the different boxes of candy provided,...
Curated OER
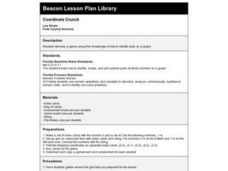
Coordinate Crunch
Learners identify plots on a graph while playing a game on a large coordinate grid and then on smaller grids.
Curated OER
Skittle Math
In this skittle math worksheet, young scholars sort skittles by color and create a bar graph for each color of skittle. Students also answer comparison, ratio, and relationship questions about the skittles.
Curated OER
Spreadsheet Graphs
Students create graphs using information from spreadsheets. They select a topic from the following choices: website use, digital cameras, spreadsheets, calculators or educational software. They tally the class results and create an...
Curated OER
Candy is Dandy
Students view the benefits of using graphs to communicate information, answer questions and solve problems. They investigate color distribution in bags of M & M's. Working with actual bags of candy, they will sort and classify contents.
Curated OER
Sorting Sweethearts
Students categorize sweetheart candy by color or message. In this sorting and graphing lesson, students collect data by sorting the candy and then diagram their results in a graph.
Curated OER
Carbon Dating
Simulate C-14 decay using M&M and Reese's Pieces candies. In this scatter-plot lesson plan, students perform an experiment to simulate the half life of C-14. Information is plotted on a scatter-plot. Students answer four...
Curated OER
M&Ms Count and Crunch
Middle schoolers practice skills involving statistics and probability by making predictions on number of each color candy in one pound bag of M&Ms. They record both guesses and actual quantities, calculate percentages, and create bar...
Curated OER
Yummy Math
Young mathematicians use bags of Skittles to help them gain practice in graphing and organizing data. They work in pairs, and after they have counted and organized their Skittles, they access a computer program which allows them to print...
Curated OER
Areology: The Study of Mars
Students use Oreo candy bars to explore how surface core samples call tell people about the history and make-up of Mars.
American Statistical Association
A Sweet Task
Candy is always an effective motivator! A fun math activity uses M&M's and Skittles to explore two-way frequency tables and conditional probability. The candy can serve a dual purpose as manipulatives and experimental data.
Curated OER
"Eggs-ploring" Math with Jellybeans
Learners work in pairs with a small bag of jellybeans to estimate the number of candies in their bags and then figure out how many groups of 10 jellybeans are contained in their bags. They then graph the information using a pictograph or...
Howard County Schools
Exponential Decay Exploration
How can you model exponential decay? Explore different situations involving exponential decay functions and decreasing linear functions by performing activities with MandM candy, popcorn kernels, and number cubes.
Statistics Education Web
Population Parameter with M-and-M's
Manufacturers' claims may or may not be accurate, so proceed with caution. Here pupils use statistics to investigate the M&M's company's claim about the percentage of each color of candy in their packaging. Through the activity,...
Curated OER
Flavorful Spreadsheets
Learners create a spreadsheet which includes a bar graph. They sort and classify information and use the average function on a spreadsheet. They research Skittles candy and summarize their findings on a spreadsheet.
Curated OER
Raising the Bar While Hogging the Ham (Radio That Is)
Students create a bar graph that communicates an amount without the need to know the exact data, determine what scale to use to best represent the data and use their bar graph to persuade others.
Curated OER
Surveying During a Basketball Game
Tenth graders conduct a survey at a high school basketball game. They compile and present the data as histograms or bar graphs.
Curated OER
Bananas! Bubble Gum! Which One?
Students design and create a graph of data they have collected on their favorite candy bars. They explore how to organize data as well.
Curated OER
Sweethearts and Data Analysis
Students explore the concept collecting and representing data. In this collecting and representing data lesson, students record the different colors of sweetheart candies in their sweethearts box. Students create a table of the data and...
Curated OER
Valentine's Day Math
First graders explore sorting and classifying. In this math lesson, 1st graders sort conversation hearts based on color. Students graph their results and enjoy the candy!
Curated OER
Edible Math
Second graders use M&M candies to graph colors, illustrate story problems and practice hands-on math. They use spreadsheets, worksheets and graphs to organize math problems that use M&M's.
Curated OER
"M&Ms"® Candies Worksheet 1
In this math worksheet, students find the likelihood of different outcomes with the use of M and M's candy for the seven questions and fill in the graphic organizer.
Curated OER
Collecting Data and Graphing
Eighth graders, in groups, count the different colors of M&M's in each kind of package and then draw a pictograph to show the results. Each group writes a program to show their results and then compare the manually-drawn and computer...
Other popular searches
- Charts and Graphs Candy
- Halloween Candy Graphing
- Graphing Candy
- Graphing Data With Candy
- Graphing Candy Corn
- Rock Candy Bar Graph
- Graphing Candy Hearts
- Graph With Candy
- M&m Candy Graph
- Excel Candy Graph
- Math Graphing Candy Canes
- Cereal or Candy Graph

