Willow Tree
Line Graphs
Some data just doesn't follow a straight path. Learners use line graphs to represent data that changes over time. They use the graphs to analyze the data and make conclusions.
Curated OER
Lesson #46: Bar Graphs and Line Graphs
In this bar graphs and line graphs worksheet, students interpret bar graphs, line graphs, and box-and-whisker plots. They find the measures of central tendency. This three-page worksheet contains notes, vocabulary, and approximately 10...
Balanced Assessment
On Averages and Curves
Determine the average on a curve. The class finds graphical representations of averages and expresses them both symbolically and on the graph. The assessment requires class members to justify using average to describe graphs.
Voice of America
Henry Ford, 1863-1947: He Revolutionized the Auto Industry
How did Henry Ford change the world? One word: automobile. After reading a two-page passage about Henry Ford's contributions to society with the invention of the automobile, readers respond to a series of 10 reading comprehension...
EngageNY
The Computation of the Slope of a Non-Vertical Line
Determine the slope when the unit rate is difficult to see. The 17th part of a 33-part series presents a situation that calls for a method to calculate the slope for any two points. It provides examples when the slope is hard to...
It's About Time
Taking a Ride on a Lithospheric Plate
Assist your pupils and broaden their horizons with several activities that determine the exact positioning of various communities over the globe. Pupils use data from the Global Positioning System to determine the position and rate of...
EngageNY
Motion Along a Line – Search Robots Again
We can mathematically model the path of a robot. Learners use parametric equations to find the location of a robot at a given time. They compare the paths of multiple robots looking for parallel and perpendicular relationships and...
Curated OER
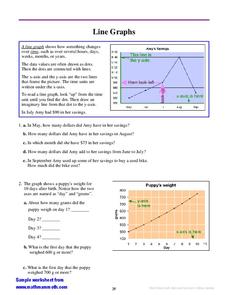
Line Graphs
For this interpreting line graphs worksheet, students read an explanation and observe an example of a line graph and its parts and then answer questions interpreting two line graphs. Students write eleven answers.
Curated OER
Earth's Rotation Changes and the Length of the Day
In this Earth's rotation and day length worksheet, students are given a table with the period of geological time, the age of the Earth and the total days per year. Students calculate the number of hours per day in each geological era,...
Inside Mathematics
Squares and Circles
It's all about lines when going around. Pupils graph the relationship between the length of a side of a square and its perimeter. Class members explain the origin in context of the side length and perimeter. They compare the graph to the...
Curated OER
Cartoons for the Classroom: Politics of Change
Empty rhetoric in Washington timelessly inspires political cartoons. Examine this concept through an analysis handout, which features a cartoon by Pat Oliphant (archived work is linked for possible extension activities). Although this...
Balanced Assessment
Ford and Ferrari
Which is faster, a Ford or a Ferrari? The short assessment has pupils analyze graphs to determine the rates of change between the two. Individuals interpret the rates of change within the context of speeds of the cars and develop a map...
K12 Reader
What Glaciers Leave Behind
Glaciers may seem distant and stationary, but they are huge deposits of moving ice that have made changes to the earth's surface. Your pupils can learn about the different types of impressions left by glaciers by reading the short...
Bowland
Fares Not Fair
What would be a fair fare for a taxi? to answer the questions requires young mathematicians to analyze data on fuel prices and taxi cab fares. They determine and justify a fair fare price.
West Contra Costa Unified School District
Sneaking Up on Slope
Pupils determine the pattern in collinear points in order to determine the next point in a sequence. Using the definition of slope, they practice using the slope formula, and finish the activity with three different ways to determine the...
Curated OER
It's Time: Expressions With "Time"
In this sentences learning exercise, students complete a ten question multiple choice on-line interactive quiz. Students complete the sentence with an expression containing the word "time".
Curated OER
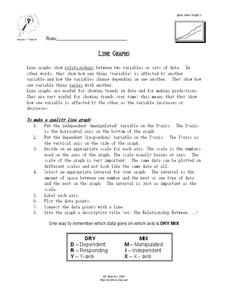
Line Graphs
In this algebra worksheet, students describe the relationship between a line graph and its data. They define the reasons line graphs are used and discuss increasing and decreasing lines. There is one involved questions, requiring several...
Willow Tree
Bar Graphs
Circles, lines, dots, boxes: graphs come in all shapes in sizes. Scholars learn how to make a bar graph using univariate data. They also analyze data using those bar graphs.
Illustrative Mathematics
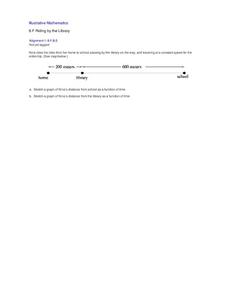
Riding by the Library
Draw a graph that shows the qualitative features of a function that has been described verbally. Make sure learners understand where time is zero and the distance is zero. It may take them some time to understand this concept, so working...
NASA
Solar Storms
In this solar storms worksheet, students use an on line source to read newspaper stories about scientific theories and hypothesis related to space weather phenomena. Students answer 7 questions about past solar storms and compare ideas...
Curated OER
Graph Made Easy: Post Test
For this graphs worksheet, students answer multiple choice questions about line graphs and bar graphs. Students answer 10 questions total.
Curated OER
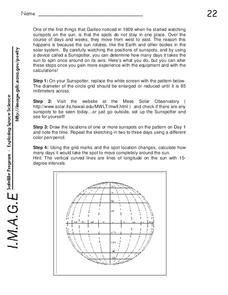
Sunspots and the Sun's Rotation
In this sun activity, students use a Sunspotter to observe the rotation of the sun by identifying the presence of sunspots and watching them rotate over time. Students calculate how many days it takes to see the sunspots they observe in...
Virginia Department of Education
May I Have Fries with That?
Not all pie graphs are about pies. The class conducts a survey on favorite fast food categories in a lesson on data representation. Pupils use the results to create a circle graph.
Curated OER
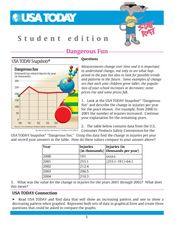
Dangerous Fun
In this line graph learning exercise, students analyze the data on a graph about toy-related injuries by year. Students solve 5 problems in which the change in injuries per year is calculated and recorded on a table.


