Curated OER
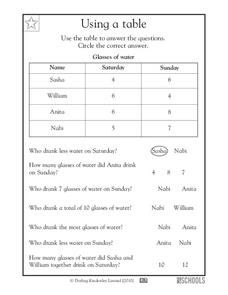
Using a Table
Tables are no help if your scholars can't read them; provide some excellent beginner-practice using this table example and accompanying comprehension questions. Learners examine the data first, which charts the number of glasses of water...
Curated OER
Plot and Conflict in W.W. Jacob's "The Monkey's Paw"
Tenth graders analyze the use of literary elements in W.W. Jacob's "The Monkey's Paw." Literary analysis is accomplished by a review of the plot and order of events in the story. Learners work in pairs to match the events from the story...
Curated OER
"User Friendly" Cause and Effect
Bring literature to life with your SMART board and this literary analysis lesson. While reading "User Friendly" by T. Ernesto Bethancourt (from the Holt Elements of Literature textbook by Kylene Beers), have your class discuss the theme...
Curated OER
Count the Images!
Based on a selection of images, learners create a bar graph depicting how many of each image is shown. There are two graphs, each with three images to chart. After they are finished, scholars can analyze the data and draw conclusions. To...
Curated OER
Line Graphs
Let's take a look at Luis' bike ride! Scholars examine a line graph charting a 20-kilometer bike ride over the course of six hours. They answer six questions about the data requiring the understand the concepts of each axis and the line...
Curated OER
Tallies
Tally Marks are a wonderful way to keep track of data, and to foster counting for your young mathematicians. This resource has learners identify the correct number of tally marks for a given number. The numbers used are: 13, 15, 17, and...
Pingry School
Qualitative Analysis of Eleven Household Chemicals
Chemical and physical properties give compounds an identity. Learners use the identity of a compound to predict what it is. By performing different tests like solubility, flame, heat, and reactions, individuals attempt to identify an...
Curated OER
Can You Bag It?
Put your class's observational skills to the test with a science experiment about paper and plastic bags. After reading some background knowledge about the materials in plastic grocery bags, third graders interpret a chart to answer a...
Curated OER
Data Handling: Tally Chart on Illnesses
In this tally chart worksheet, students analyze a chart showing childhood illness cases. Students use the tally chart to solve 6 problems.
Curated OER
Tally Chart: Favorite Names
In this data display instructional activity, students analyze a tally chart of favorite hamster names. Using the information on the chart, students solve 8 word problems.
National Endowment for the Humanities
David Walker vs. John Day: Two Nineteenth-Century Free Black Men
What was the most beneficial policy for nineteenth-century African Americans: to stay in the United States and work for freedom, or to immigrate to a new place and build a society elsewhere? Your young historians will construct an...
Curated OER
Ethics Activity: Issue Analysis
Learners analyze environmental health issues with respect to the players, their positions, and associated values, after being introduced to the concepts of events, problems, and issues. They apply the skills of issue analysis to...
Curated OER
Literature Analysis
Students examine the attributes of stories. In this literary elements lesson, students discuss the characters, plots, and settings of books they read in class.
Curated OER
Communicating Data
In this data worksheet, students match information with the best type of graph to display it. Students also make a chart and graph to display information in a given paragraph.
Curated OER
Using Excel to Reference and Graph Live Data from a Web Site
Students collect live buoy data about water temperatures in the Gulf of Mexico from the Internet and work individually to organize their data and create a line graph using Excel Spreadsheet. Students analyze their data and examine any...
Willow Tree
Histograms and Venn Diagrams
There are many different options for graphing data, which can be overwhelming even for experienced mathematcians. This time, the focus is on histograms and Venn diagrams that highlight the frequency of a range of data and overlap of...
Balanced Assessment
Oil Consumption
An assessment presents a chart displaying oil consumption Pupils use the chart to determine the greatest increase in consumption, and then apply that information to figure out when the consumption may reach 100 million barrels a day.
NOAA
The Oceanographic Yo-yo
How does chemistry help deep-sea explorers? Part four of a five-part series of lessons from aboard the Okeanos Explorer introduces middle school scientists to technologies used in ocean exploration. Groups work together to analyze data...
Concord Consortium
People and Places
Graph growth in the US. Given population and area data for the United States for a period of 200 years, class members create graphs to interpret the growth over time. Graphs include population, area, population density, and population...
Historical Thinking Matters
Rosa Parks: 3 Day Lesson
How can evidence and perspective challenge even the most well-known of stories? Through primary and secondary source analysis, think-alouds, and discussion, young historians evaluate the historical narrative of Rosa Parks across multiple...
Curated OER
Collect and Organize Data: Homework
In this collecting and organizing data worksheet, learners use the tally chart for the students' eye color to answer the first two questions. Learners then survey their family for eye color, record those results in a tally chart, and use...
Curated OER
Describing Data
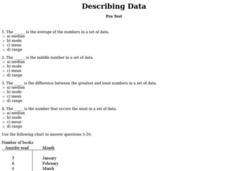
In this data worksheet, students complete multiple choice questions about mean, median, mode, and range. Students complete 10 questions total.
Curated OER
Collect and Organize Data: Reteach
In this data collection instructional activity, students learn the parts of a tally chart and how it organizes information. Students then use the second tally chart to help them answer the six questions.
Curated OER
Chart This!
Pupils collect and analyze data. In this middle school mathematics instructional activity, students collect data on three to four traits or favorites. Pupils analyze their data and create a chart of graph for each trait or favorite...


