Curated OER
Probability Fun
What are the chances? Probability comes into play in this worksheet as mathematicians examine a circular chart with images, determining the possibility that the "spinner" will land on each of the images. Appropriate for younger...
Curated OER
Calculate Percentages
Sixth and seventh graders study the concept of finding the percent of a number. They calculate the percent of any given number. Pupils describe ways to use calculating percents in their daily life, and change percents into decimals,...
Curated OER
Water: From Neglect to Respect
The goal of this collection of lessons is to make middle schoolers more aware of the ways in which they are dependent upon water to maintain their standard of living. Learners compare water use in Lesotho to water use in the United...
Curated OER
A World of Information
Students analyze data and statistics about countries around the world. They read graphs and charts, color a world map to illustrate the top ten statistics about the world, and write a paragraph to summarize their information.
Curated OER
Quarter, Nickel, Dime....
An engaging game called, "Quarter, Nickel, and Dime" is presented in this math lesson. Players are given an envelope with slips of paper that represent the three coins. In pairs, they play the game 18 times, and the whole class charts...
Deliberating in a Democracy
Cyberbullying—Alternate Lesson Plan
Should schools be permitted to punish young scholars for off-campus cyberbullying? After reading a passage that details statistics about cyberbullying and Supreme Court rulings about schools' ability to limit student speech,...
Curated OER
Measuring Soil Temperatures at South Penquite Farm
Students investigate soil temperatures. In this graphing and earth science lesson, students insert temperature probes into different types of soil at varying depths. Students complete a data chart and construct a related graph...
Federal Reserve Bank
Measuring the Great Depression
Young historians examine the cost of goods and services through the Consumer Price Index (CPI), output measured by Gross Domestic Product (GDP), and unemployment measured by the unemployment rate to gain an understanding of the economic...
Alabama Learning Exchange
Yummy Apples!
Young learners listen to a read aloud of Gail Gibbons book, Apples and the story A Red House With No Windows and No Doors. They compare characteristics of a number of kinds of apples, graph them and create a apple print picture. Learners...
Curated OER
Mr. Cobbler's Shoe Dilemma
Students employ statistics to solve real-world problems. They collect, organize and describe data. They make inferences based on data analysis. They construct, read, and interpret tables, charts and graphs.
Curated OER
What's Your Favorite Season?
Students collect data on the favorite seasons. In this data collection and analysis lesson, students learn about displaying data on charts and graphs. They collect data about the favorite seasons of the children in their class and...
Cornell University
Math Is Malleable?
Learn about polymers while playing with shrinky dinks. Young scholars create a shrinky dink design, bake it, and then record the area, volume, and thickness over time. They model the data using a graph and highlight the key features of...
Curated OER
Where Oh Where on the Playground, Do I Love To Be?
Students listen to poem, Where Oh Where On the Playground, Do I Love to Be?, and practice reading, interpreting, and making maps, charts, and graphs in surveying classmates and discussing their favorite places to play in school playground.
Curated OER
LOOKING AT LAWNS
Students investigate the importance of plants to animals by exploring their own schoolyard. They record relevant observations, findings, and measurements, using written language, drawings, charts, and graphs. They describe ways in...
Curated OER
An Encyclo-ME-dia for Every Child
Learners create a digital scrapbook that shows information-text and pictures that are specific to each child. They make charts and graphs. They use digital cameras, scanners, software, to write captions, stories, poems, letters, and...
Curated OER
Inference Lesson Plan
Young scholars practice assessing graphics to infer and identify an author's implicit and explicit meaning in a piece of text. They evaluate the effectiveness of information found in maps, charts, tables, graphs, diagrams, cutaways and...
Curated OER
Santa's List Sums (G2)
In this Christmas math worksheet, students help Santa know the number of children on the given streets in the chart. Students find the sum of the boys and girls for the 17 problems.
Math Learning Center
Fourth Grade Assessments and Scoring Checklists, Common Core State Standards
Find out how your class is progressing in math with a set of assessments. Learners finish a baseline assignment to assess where they are beginning the year and then work on tests with increasing difficulty as the year progresses.
Curated OER
Cindy and Linda - Selling Lemonade
In this pie charts worksheet, students use the pie chart to count how many glasses of Lemonade were sold by Cindy and Linda. Students complete the table and answer 3 questions.
Curated OER
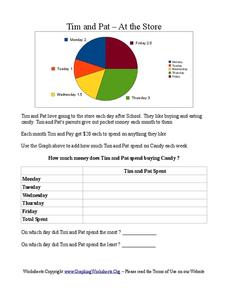
Tim and Pat - At the Store
In this pie chart worksheet, students use the pie chart to add the amount of time Tim and Pat spend buying candy each day of the week. Students answer 2 questions about the table.
Curated OER
Handling Data
Students create a simple table in order to solve a problem. As a class, they create a simple data table in order to discover the number of letters in each student's name. This data is interpreted in order to answer questions and make...
Curated OER
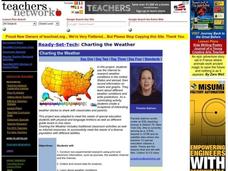
Charting the Weather
Students research and conduct non-experimental research, such as journals, the weather channel and the internet, to collect and record data for analysis on weather conditions in the United States and abroad. They identify, pronounce and...
Curated OER
Education for Global Peace
Fifth graders construct data graphs based upon sets of data. In this graphing lesson, 5th graders read the text If the World Were a Village and discuss how types of graphs accurately represent a large population. Students construct their...
Curated OER
What's The Weather?
Second graders record and summarize daily weather observations for a week in the form of a bar graph. They cut and glue a weather symbol for each day, record it on the graph, and answer discussion questions.
Other popular searches
- Pie Charts and Graphs
- Reading Charts and Graphs
- Behavior Charts and Graphs
- Charts and Graphs Candy
- Interpret Charts and Graphs
- Charts and Graphs Christmas
- Charts and Graphs Math
- Analyzing Charts and Graphs
- Tables, Charts and Graphs
- Charts and Graphs Europe
- Using Charts and Graphs
- Bar Graphs and Charts

