Curated OER
Sunshine Math 4
In this cumulative math review worksheet, learners respond to a variety of review questions which can be used for practice testing. Students answer 9 questions pertaining to charts and graphs, word problems, measurement, fractions, and...
Curated OER
Countdown to Disaster
Students discover the potential dangers of weather in their hometown. In this environmental lesson, students research Hurricane Hugo and the devastation it caused South Carolina in 1989. Students record weather data from...
Curated OER
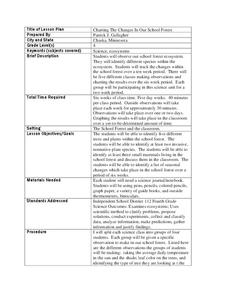
Charting the Changes in Our School Forest
Fourth graders investigate the ecosystem and how forests are disappearing. For this environmental protection lesson, 4th graders analyze the changes in their school for 2 weeks. Students practice identifying trees, birds, and...
Curated OER
Swimmy's Friends
Students solve problems using various strategies. In this problem solving lesson, students read the book Swimmy by Leo Lionni. Students make fish swimming patterns, measure how many goldfish crackers it takes to make a handprint and...
Curated OER
Bird and Breakfast
Students examine winter birds. In this KWL chart lesson, students fill out the chart and view a PowerPoint presentation. Students then complete the chart and discuss winter birds.
Curated OER
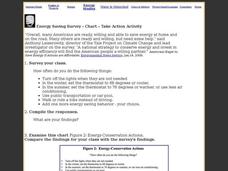
Energy Saving Survey - Chart - Take Action Activity
In this saving energy instructional activity, students survey the class about saving energy, examine an energy chart, and answer short answer questions. Students complete 4 tasks.
Curated OER
Pronouns and Nouns
Second graders identify nouns and pronouns from a story. In this nouns and pronouns lesson plan, 2nd graders review the definition of these words. Students then locate nouns and pronouns in the book they are reading. Students list these...
Curated OER
Equal Parts
In this equal parts worksheet, students, working with a partner, study, formulate and calculate the answers to six word problems or drawings.
Curated OER
You Know, Jack
Increase communication skills, especially among your ESL population, with this activity. Get children up and out of their seats asking clarifying questions about their hypothetical friend "Jack." A chart categorizes questions into "last...
Curated OER
Ready for Roots
Fourth graders sort seeds and predict what conditions are needed for them to germinate. They keep the seeds moist, observe and measure their growth and graph the results. As the seeds start to grow students compare and contrast the each...
Curated OER
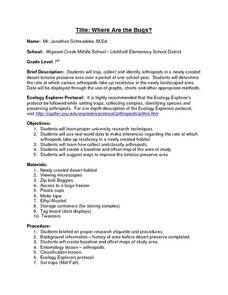
Where Are the Bugs?
Students trap, collect and identify arthropods in a newly created desert tortoise preserve area over a period of one school year. They determine the rate at which various arthropods take up residence in the newly landscaped area. Data is...
Curated OER
Death by Particles
Emerging epidemiologists define relative risk and read an article about the effect of particulate pollution on the cardiovascular health of women. They record the relative risk values, graph them, and answer analysis questions. This is a...
Curated OER
MAISA and the REMC Association of Michigan
Learners complete online research to study geography's impact on weather. In this geography and weather lesson, students research weather in their city for ten days using an online website. Learners bookmark the site, enter data into a...
Curated OER
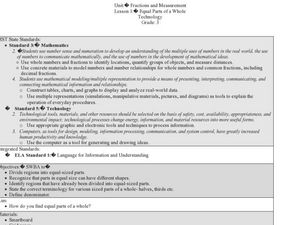
Fractions and Measurement
Using a Smart Board, or a plain ol' white board or chalkboard, the teacher pulls up a grid and demonstrates how squares and rectangles can be divided up into equal parts. The class will get their own graph paper to draw shapes and divide...
Curated OER
Virtual Field Trip / Route, Mileage and Gasoline Cost Graphs
Pupils use a spreadsheet program to graph and compare milage, gasoline costs and travel time for two travel routes in their virtual field trip in Michigan. They determine the most economical route based on the graphs and calculations.
Curated OER
Graph Both Crusts
Fourth graders calculate the angles and construct a pie graph of the percentages of the elements in the continental and oceanic crusts. Then they analyze the results. They can be assigned the task of researching the percentages.
Curated OER
Graph Made Easy-Pre Test Questions
In this graphing pre test instructional activity, students complete a set of 10 multiple choice questions. Page is labeled as a pretest, an answer link is provided.
Curated OER
Creating and Analyzing Graphs of Tropospheric Ozone
Students create and analyze graphs using archived atmospheric data to compare the ozone levels of selected regions around the world.
Curated OER
Graphing Inertia: An Oxymoron?
Eighth graders investigate Newton's Law of Inertia in order to create a context for the review of the use of different types of graphs. They practice gathering the data from an experiment and put it into the correct corresponding graph.
Curated OER
Graphs Abound
Students create a survey for their classmates to collect data on their favorite foods, eye color, pets or other categorical data. They compile the data from the survey in a table and then make a bar graph of each category using a web tool.
Curated OER
Graph Your Foot!
Students measure their own foot and place the outline on a graph. They make connections between the size of their foot and the bar graph that represents it.
Curated OER
Graphing a Healthy Lifestyle
Fifth graders record the amount of time they spend sleeping, attending school, watching T.V., exercising and doing homework. At the end of the week they graph all of their information and discuss how sleep impacts their learning....
Curated OER
Monster Graph Activity
Seventh graders engage in a instructional activity which take the fear out of graphing. They create and draw conclusions from data found in a Monster graph.
Curated OER
Let's Graph It!
Students graph the height of others in centimeters and inches, find the slope of line in order to calculate the conversion factor between centimeters and inches.
Other popular searches
- Pie Charts and Graphs
- Reading Charts and Graphs
- Behavior Charts and Graphs
- Charts and Graphs Candy
- Interpret Charts and Graphs
- Charts and Graphs Christmas
- Charts and Graphs Math
- Analyzing Charts and Graphs
- Tables, Charts and Graphs
- Charts and Graphs Europe
- Using Charts and Graphs
- Bar Graphs and Charts


