Curated OER
Latitude and Longitude: Geography and Geometry!
Second graders use latitude and longitude coordinates to pinpoint an exact location on the map. For this geography lesson, 2nd graders utilize handouts from the Maritime Museum in order to gain practice in finding locations throughout...
Curated OER
CHARTING NEPTUNE'S REALM
Students design a twenty-first century book cover based on the concepts and designs of the eighteenth century.
Curated OER
RIDING THE WIND
Students locate the Trade Winds, Westerlies and Polar Easterlies on a map, explain the impact of the rotation of the Earth, and plot a route for a round trip voyage from New York to London.
Curated OER
Memoir
After reading and analyzing two narrative memoirs, middle schoolers engage in a variety of activities, including writing an essay, developing a story map, and creating character charts. They then compare and contrast story maps, and...
Curated OER
Non-Fiction Text Features
Distinguish between textual features of non-fiction in the book The Lewis and Clark Expedition and in the non-fiction story "Ta-Na-e-Ka." Third graders create posters and participate in group discussions to show their...
Ontario
Reading Graphic Text
Do students really need to be taught how to read cartoons, comic books, and comic strips? Yes. Just as they need to learn how to read other forms of graphic text such as diagrams, photos, timetables, maps, charts, and tables. Young...
Curated OER
The Silk Road, An Ancient Internet
Pupils examine how goods and ideas moved along an ancient trade route between China and Europe. They make charts of items, ideas, etc. that were transported along the Silk Route.
Curated OER
Population Density
Learners examine world population density and population distribution. They create pie charts showing population distribution and analyze population patterns in the United States and major regions of the world. They identify...
Curated OER
Where Are the Bugs?
Students trap, collect and identify arthropods in a newly created desert tortoise preserve area over a period of one school year. They determine the rate at which various arthropods take up residence in the newly landscaped area. Data is...
Curated OER
Where is Everybody?
Students collect data from different grade levels at their school and develop thematic maps which show population density, and determine how this might affect the school and themselves in the future.
Curated OER
What's For Dinner?
Eighth graders discover how the location of restaurants affects the future location of different restaurants. Using a fictionous town, they map the locations of all current restaurants and analyze the data to determine what type of...
Curated OER
Latitude
Students examine the theory of finding latitude and discuss the uses of an astrolabe, cross-staff and octant. They determine an Astronomical Table for their classroom.
Curated OER
Exploring Wyoming Species Habitats
Learners are introduced to the concept of species habitats and ranges. They introduced to ArcView GIS as a tool for mapping. Pupils use query data for species withina county, elevation, range, rivers and streams, land cover, and etc....
Curated OER
From There To Here...
Students find out where some of the products in hour homes come from, then become aware of our local trash, landfills and incinerators. They chart and graph data and use maps for different purposes.
Curated OER
Sea Changes: A New England Industry
Young scholars conduct research in order to use primary and secondary sources. They interpret and analyze information from textbooks and nonfiction books for young adults, as well as reference materials, audio and media presentations,...
Curated OER
Singing for the Animals
Learners examine the correct attitudes and poster for a concert. In this "Singing for Animals" lesson, students created charts to diagram information about the homeless animals they were singing for. Learners used correct diction and...
Michigan Sea Grant
What's in This Water?
Pupils investigate the biological and chemical characteristics of water to determine where purple loosestrife occurs. They create data sheets to record water quality tests in several locations and work in groups to conduct the water...
Curated OER
Landscape Diversity in the Yukon Territory
Students review and analyze a satellite image of the Yukon territory.
Curated OER
Charlotte's Web
Fourth graders focus on fluency by reading the book Charlotte's Web. In this reading strategies instructional activity, 4th graders partner read, do guided reading, and independent reading to increase fluency. Students use Venn...
Curated OER
Planetary Poster
Students engage in a study about the planets and create a poster as one of the projects during the study. They create individual charts for mapping the solar system so the locations can be found in mock space missions to other planets.
Curated OER
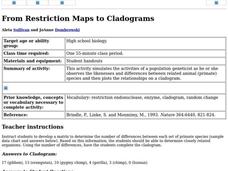
From Restriction Maps to Cladograms
Students develop a matrix to determine the number of differences between each set of primate species. They determine closely related organisms then complete the cladogram and answer a set of questions.
Curated OER
Mapping River Statistics
High schoolers research different statistics to do with the Mississippi River. They answer questions about finding data and collect it by conducting research. The research is used to construct a data table. Then students use the table to...
Curated OER
Lesson 1 Activity 1: Tools of the Ancients
Students examine how Christopher Columbus determined his latitude.
Curated OER
National Marine Sanctuaries Shipwrecks
Junior oceanographers access the Channel Islands National Marine Sanctuary Shipwreck Database and plot the locations of several shipwrecks. Shipwrecks are always an enthralling subject and this activity allows your learners to act as...
Other popular searches
- Maps and Charts
- Analyze Maps and Charts
- Reading Maps and Charts
- Ireland Maps and Charts
- Tables, Maps and Charts
- Maps Graphs and Charts
- Maps, Charts, Globes
- Interpreting Charts and Maps
- Tables Maps and Charts
- Graphs, Charts and Maps
- Graphs\, Charts and Maps
- Word Maps and Charts
