Curated OER
A Comparison Study of Water Vapor Data to Precipitation over North America
Students use NASA satellite data to compare water vapor over the United States. In this data analysis instructional activity students use an Excel spreadsheet to map their data.
Curated OER
Air Pollution: What's the Solution?
This air pollution worksheet provides a step-by-step process for gathering data about the ozone and weather. Amateur meteorologists enter data for 3 days including the air quality, the temperature, the wind speed, any particular events...
Curated OER
United States Climates
Students identify regional climates by using weather maps. They, in groups, locate and mark their city on the small map, then go to the larger map to locate and mark their city when they are called upon by teacher.
Curated OER
What Causes Irregular Temperature Patterns?
Students examine common trends in climate across the U.S. They identify the anomalies in hot-cold temperature differences in the U.S and locate them on the map using latitude and longitude coordinates.
Curated OER
Our Eye in the Sky: The TIROS Weather Satellite
Young scholars investigate the political context of the creation of a weather satellite. In this technology and society lesson, students explore the historical, technological, and political context of the TIROS weather satellite. They...
Curated OER
Classroom Meteorologists: An Experiential Approach to Learning about Seasons and Weather
Students examine several concepts about weather in the seven lessons of this unit. This year long activity helps students to gather data seasonally about wind, clouds, precipitation, and temperature. Earth's three climate zones are...
Curated OER
Graphing and Analyzing Biome Data
Students explore biome data. In this world geography and weather data analysis lesson, students record data about weather conditions in North Carolina, Las Vegas, and Brazil. Students convert Fahrenheit degrees to Celsius degrees and use...
Curated OER
Infrared-Hot
Students describe how the sun heats the Earth, explain the nature of infrared light, explain how thunderstorms are formed and use infrared maps to predict severe weather.
Curated OER
Observing Wind Speed and Cloudiness
Observiing the atmosphere is always a fascinating past time. In this science instructional activity, learners are encouraged to observe the wind speed and cloudiness present each day. The observations take place over a period of three...
Curated OER
Drought Threatens Huge Man-Made Lake
Students locate Lake Mead, then read a news article about Lake Mead drying up and how that would effect water and power supplies to the region. In this current events lesson, the teacher introduces the article with a map and vocabulary...
Curated OER
Understanding Cloud Formation
Students read and relate the poem, "Clouds" by Aileen Fisher to a demonstration on cloud formation. They create clouds in jars using ice water and matches then discuss the ways clouds can be used to predict weather.
Curated OER
MountainQuest!
Your scientists are employed by NASA! They have to evaluate five potential sites around the world and decide which location would serve the scientists best. There are comprehensive lesson plans for this electronic field trip, and your...
Curated OER
Highs and Lows
Students use email to chart weather patterns and then graph their findings. In this weather patterns lesson, students chart their weather for a week at the school. Students then use email to find temperatures at a variety of locations....
Curated OER
Meteorological Predictions
Pupils make a link between prediction and hypothesis in math and science. Based on data collected over one week, students evaluate the predictions of local weather forecasters, compare the predicted outcomes to the actual weather...
Wild BC
Weather Where We Live
Over a span of two weeks or more, mini meteorologists record weather-related measurements. What makes this particular resource different from others covering similar activities are the thorough details for the teacher and printables for...
Curated OER
Weather Watchers
Students identify basic weather instruments and how they are used to record weather data. Students define several vocabulary terms as stated in lesson. Students use basic instruments to record weather data in their area. Students use the...
NASA
Observing Monsoon Weather Patterns with TRMM Data
Follow a fabulous slide show on how monsoons form and how satellite technology is being used to observe the phenomena, explaining why they occur. Afterward, visit the TRMM (Tropical Rainfall Measuring Mission) website to access actual...
Curated OER
Hurricane Frequency and Intensity
Students examine hurricanes. In this web-based meteorology instructional activity, students study the relationship between ocean temperature and hurricane intensity. They differentiate between intensity and frequency of hurricanes.
Curated OER
Cloudy With a Chance of...
Second graders will write a story. In this writing and meteorology lesson, 2nd graders read the story Cloudy With a Chance of Meatballs, then use KidPix to create a weather picture. The picture is imported into a word processor and the...
Curated OER
"Weather Watch"
Students investigate components of weather and the climate in areas around the country. They analyze data from the University of Michigan weather website, complete a weather watch worksheet, and graph weather data.
Curated OER
Global Warming
This contains a writing prompt about global warming that could be adapted in a number of ways. The resource provides some information about global warming and possible effects. Learners explore the enhanced greenhouse effect and the...
Curated OER
Weather Forecasting
High schoolers examine cold, warm, and stationary fronts. They also examine the roles of relative humidity and the way air masses move. They are to create forecasts based on the information they collect. Tapes are shared with the class.
NASA
The Case of the Wacky Water Cycle
Join the tree house detectives in learning about the processes of the water cycle, water conservation, water treatment, and water as a limited resource.
Curated OER
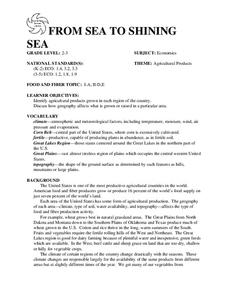
FROM SEA TO SHINING SEA
Identify agricultural products grown in each region of the country.
Discuss how geography affects what is grown or raised in a particular area.1. Hand out a copy of the two activity sheets "Food From Sea to Shining Sea" to each student....


