Curated OER
Graph Lesson
First graders collect data on different eye colors of each student in their classroom. They input the data that they gathered in an Excel spreadsheet and then create a graph in Excel.
Curated OER
A Sweet Drink
Students investigate reaction rates. In this seventh or eighth grade mathematics lesson, students collect, record, and analyze data regarding how the temperature of water affects the dissolving time of a sugar cube. Studetns determin...
Curated OER
Probability and Applications of Simulations
Middle schoolers apply properties of probability to the real world. In this probability lesson, learners simulate the construction of empirical distribution. They collect and analyze data using central tendencies.
Curated OER
Height versus Shoe Size
Young scholars find a correlation between a person's height and his/her shoe size. They have access to entering data into lists on a graphing calculator and can complete scatter plots. Students read and interpret a scatter plot and use...
Curated OER
Shoe Showdown
Third graders use rulers to measure their shoe size in inches and centimeters. They then enter the class shoe measurements into an excel data base and graph the results of both to make the comparison.
Curated OER
Reading & Using a Nutrition Label
Students discover the importance of healthy eating. Using food nutrition labels, they read and examine the nutritional value. Students collect the data on a spreadsheet and create a graph. They analyze the media influences on product...
Curated OER
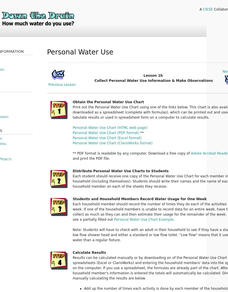
Down the Drain: How Much Water Do You Use?
Participate in an Internet-based project to share information about water usage with other students. Collect information about water usage and compare it to the average used by people in other parts of the world.
Curated OER
Kinzi Deaf Alumni
Students use data of school alumni to create a database. The lesson uses technology and access to a computer lab is essential. The concepts of graphing statistics is also used to help teach across the curriculum.
Curated OER
Favorite Apple Graph
First graders record their favorite type of apple in the form of a graph. They each try one slice of a Red Delicious, Golden Delicious, and Granny Smith apple, select their favorite type, and create a class graph using the data collected.
Curated OER
Exploring Circles
Learners explore circles using a graphing calculator. In this circles lesson, students write the equation of a circle with a given center and radius length. Learners find the most appropriate model for each combination of data they...
Curated OER
Making Numbers Manageable
Eighth graders recognize and express numbers when written in time saving techniques. They gather data from a variety of sources, including print and electronic media. They develop a presentation using a variety of techniques.
Curated OER
Toothpick Tops
Students assembly tops and name them 1 - 12 so that they can compare their results. They guess which top they think will spin the best and then record data on "Toothpick Top" table. Using a stopwatch or clock to measure and record the...
Curated OER
Old Glory
Students utilize mathematical concepts such as: measurement, ratio and proportion and geometric probability to analyze the components of the U.S. Flag. They collect, organize and interpret data by constructing charts, tables and graphs...
Curated OER
Baseball Stats
Students explore data sheets and statistics in baseball. They use baseball data available on the Internet to develop an understanding of the different ways in which data can be analyzed.
Curated OER
Is there Treasure in Trash?
More people, more garbage! Young environmentalists graph population growth against the amount of garbage generated per year and find a linear model that best fits the data. This is an older resource that could benefit from more recent...
Curated OER
How Does Your Population Grown?
Do you know how the population has grown of your community? Can you predict the population over the next half century? Can we find an algebraic model that matches our data? These along with many more questions can be researched by...
Curated OER
Survey Says...
Young learners create and implement a school-wide survey about student body favorites! Learners record and analyze the data on a bar graph, picture graph, and line graph, and then display the data. Then, wrap it all up with a celebration...
Curated OER
Investigation - How Tall is the Average Sixth Grader?
Pupils will measure each other and record the data in inches. They will use a stem and leaf plot to display data and figure out the average height of the students in a class. The other statistical data will be collected like the mode and...
Curated OER
Math TODAY - Breast Cancer Risks
Learners explore data that be modeled by a logistic function. They have the opportunity to study real-life data and create a mathematical function to model the data and make a prediction.
Curated OER
I Wonder How Fast Manduca Grows Compared To Me
Students study the Manduca bug and its growth data. They look for patterns and compare their own growth rate to that of the Manduca.
Curated OER
How Much is There to Eat?
High schoolers examine food production related to population density. In this interdisciplinary lesson, students gather data regarding food production in the American South and in India. High schoolers follow the outlined steps to...
Curated OER
Student Census
Students collect data from their peers and store the information in a database. As students manage the information they realize the usefulness of a database as a tool to manage large amounts of information in an efficient and accurate...
Curated OER
Why Doesn't My New Shirt Fit?
Pupils test Leonardo da Vinci's view of the human body by measuring various body parts using a tape measure. They create a data table and a scatter plot and then analyze and interpret the results using a graphing calculator.
Curated OER
Making Sense of the Census
Learners problem solve the mean and median of agricultural data by completing a worksheet. They discuss the results of the statistical data.


