Utah Education Network (UEN)
The Pasture and the Fence
Beginning geometers use tiles and grid paper to draw and calculate perimeter and area. Rectangles of different sizes are created and then measured to build understanding. The one-inch grid sheet referenced is attached.
Curated OER
What Portraits Reveal
High schoolers examine how portraits can tell us more about people of the past than just what they looked like. They compare three portraits of U.S. Presidents, analyze portraits of Americans from the Revolutionary War, and write a...
Curated OER
Picturing History: John Singleton Copley and British Portraiture
Students observe and compare 18th century British portraits with those made by John Singleton Copley. By conducting research they explore the cultural climate of the portraits in order to write a historically accurate story.
Curated OER
Pizza! Pizza!
Third graders tally, sort, and organize pizza orders from monthly school sales. They create an advertising campaign to promote the School Pizza Sale, record the data in graph form, compare and contrast the tallies throughout the year,...
NOAA
Ground-truthing Satellite Imagery with Drifting Buoy Data
Ground-truthing ... is it even a word? The last installment of a five-part series analyzes how scientists collect sea surface temperature data. Scholars use government websites to compare temperature data collected directly from buoys...
Virginia Department of Education
Analyzing and Interpreting Statistics
Use measures of variance to compare and analyze data sets. Pupils match histograms of data sets to their respective statistical measures. They then use calculated statistics to further analyze groups of data and use the results to make...
Curated OER
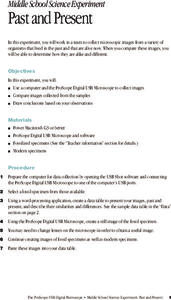
Past and Present
Students compare fossilized specimens to contemporary specimens. They use a computer and a Proscope Digital USB Microscope to collect and compare images of ferns, sand dollars and sow bugs to those of similar fossilized samples.
Curated OER
Cover Up: Tools for Integrating Math and Engineering
Blend art, adolescent snacking habits, and math to create new cereal boxes. Secondary learners review scale drawings. They use this information to construct cereal boxes to scale and will compare their creation to the original product to...
Inside Mathematics
Marble Game
Pupils determine the theoretical probability of winning a game of marbles. Individuals compare the theoretical probability to experimental probability for the same game. They continue on to compare two different probability games.
Curated OER
How Big Is a Blue?
Students sort and compare/contrast the lengths of various whales. They sort pictures of whales in order of smallest to largest, and given a rope marked with the lengths of the whales, they compare the actual lengths of the whales.
Curated OER
The Aztecs - Mighty Warriors of Mexico
Upper elementary learners identify the Aztecs as the builders of a great city and rich civilization in what is now Mexico. They locate the Aztec Empire and its capital on a map and place the Aztecs in the chronology of American history....
Curated OER
Jeopardy
High schoolers played a game of Jeopardy where there was five categories with five questions each in order to assess the retention of concepts taught over the semester. The categories included: Graphing/Summarizing/ Scientific Method,...
Foreign Policy Research Institute
Democracy Wall
How free are people in the United States, or in the world for that matter? The class reads and compares two articles that discuss levels of freedom enjoyed by different people around the globe. They discuss why some people have more...
Curated OER
It Counts
Students classify and compare plants using specific information, observations, and numbers. In this mathematical inquiry lesson, students use plant characteristics to describe, compare, and classify them. They attempt to develop a system...
Curated OER
Columbus: Hero or Villain?
Students explore Christopher Columbus's motives. In this character education lesson, students research Internet and print sources regarding the life and actions of Christopher Columbus in order to write essays that his actions as the...
Curated OER
Build a Bar Graph
Learners discover how to use bar graphs. They will gather and organize specific data in order to put it into a bar graph. Then they will answer several questions based on the information they have graphed.
Curated OER
Fractions of A Pizza
Students view a large illustration of a pizza with parts of velcro. In this addition and subtraction of fractions lesson, students solve problems based on the pieces missing from the pizza. Students take a fraction quiz. Order a fresh,...
Southern Nevada Regional Professional Development Program
Evaluating Media Sources
Just how much influence did television have on the results of the 1960 presidential election? Media critics contend that the results were all about how the two candidates appeared on the screen. Give your young historians a chance to...
Curated OER
The Adventures of Tom Sawyer: Magic Square Vocabulary
Before getting too far into The Adventures of Tom Sawyer, support your learners by introducing and practicing some vocabulary that might be unfamiliar to them. The vocabulary exercise here includes 16 words from the third and fourth...
Illustrative Mathematics
Kimi and Jordan
Kimi and Jordan have taken summer jobs to supplement their weekly allowances. Kimi earns more per hour than Jordan, but Jordan's weekly allowance is greater. This activity asks students to determine how the incomes of the two workers...
Illustrative Mathematics
Placing a Square Root on the Number Line
There are many ways to approach finding the rational approximation of an unknown square root. Here is a problem that will help math learners make a connection between square roots and their order on a number line. As usual, determine two...
US Environmental Protection Agency
Weather and Climate: What's the Difference?
Future weather forecasters collect daily temperatures over a period of time. Afterward, they compare their data with monthly averages, as researched on national weather websites, in order to grasp the difference between weather and...
US Environmental Protection Agency
Tree Rings: Living Records of Climate
Open with a discussion on weather and climate and then explain how tree rings can provide scientists with information about the earth's past climate. Pupils analyze graphics of simulated tree rings from various US locations for the...
Discovery Education
Fuss About Dust
Dust is everywhere around us; it's unavoidable. But what exactly is dust and are certain locations dustier than others? These are the questions students try to answer in an interesting scientific investigation. Working independently or...
Other popular searches
- Compare and Order Decimals
- Compare and Order Fractions
- Compare and Order Numbers
- Compare and Order Integers
- Compare and Order Money
- Compare Order Fractions
- Compare Order Money
- Compare and Order Capacity
- Compare Order Numbers
- Math Compare and Order
- Compare Order Decimals
- Order Compare Whole Numbers


