Curated OER
Bar Graphs and Pie Charts
Students graph data they collected and analyze it using a bar graph. In this algebra lesson, students analyze their data using pie charts and bar graphs while explaining the meaning to each other. They compare and contrast bar graphs vs...
Curated OER
Wetland/Estuary Structure and Functions
Students plant wetland plants in aquatic soil and regular soil. They test the effect fertilizers have on each and record the chemicals found in run-off water collected from each soil sample.
Curated OER
Political Issues Survey
Fifth graders develop and conduct a survey regarding issues in a current political campaign. They distribute and collect the surveys, input the data using a spreadsheet program, and compare/contrast the recorded results.
Curated OER
Misleading Histograms
In this recognizing and interpreting a histogram worksheet, students read and record the data and answer word problems using that data. Students solve 14 problems.
Curated OER
Identifying My Spider
Third graders navigate the Internet and research spiders. In this spider lesson, 3rd graders view photos of spiders and use their characteristics to determine the variety of spider. Students complete a spider data sheet.
Curated OER
Geoboard Area
Students explore the basic geometric shapes and geometric shape vocabulary through the use of geoboards and virtual geoboards. They create a variety of shapes with a partner, build ten different rectangles on their geoboards, and...
Curated OER
Tight Rope
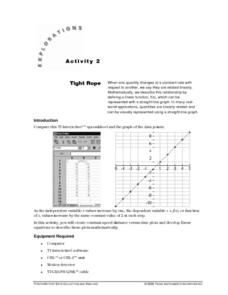
Learn how to explore the concept of linear functions. In this linear functions lesson, high schoolers collect linear data from a motion detector. Students walk to create a linear function. High schoolers plot the points on a graph and...
Curated OER
Decisions, Decisions, Decisions
Students examine graphs to find the most appropriate for various kinds of data. In this graphing lesson, student create bar, line and circle graphs. Students create graphs electronically and manually interpreting the data.
Curated OER
Birth and Early Childhood
Eighth graders read and compare creation stories of different cultures around the world. They identify and define the concept of the cycle of life and collect and analyze birth and childhood folk beliefs and stories in their families...
Curated OER
Mapping The Ocean Floor
Young scholars explore and analyze the bottom structure of underwater habitats. They describe and explain what can't see through the collection and correlation of accurate data. Learners assess that technology is utilized as a tool for...
Curated OER
Seasonal Cloud Cover Variations
Students, in groups, access data from the NASA website Live Access Server regarding seasonal cloud coverage and the type of clouds that make up the coverage. They graph the data and make correlations between types, seasons and percentages.
Curated OER
Measuring Biodiversity
Learners collect species data from a mock intertidal community. In this biology lesson, students graph their data and analyze the species in it. They construct a species accumulation curve and present it to class.
Curated OER
Value Your Digits
Third graders work with place value. In this place value lesson, 3rd graders write three digit numbers and tell the place value of each number. They compare numbers and money, regroup, discuss the value of coins, and count money.
Curated OER
That Is a Lot of Rain
Learners investigate the amount of rainfall in Manu, Peru. They view and discuss a video and fill a rain guage with the amount of rainfall in Manu. They research and compare local rainfall amounts to those of Manu, and write about what...
Texas Instruments
Math TODAY for TI-Navigator System - Is Leisure Time Really Shrinking?
High schoolers organize data from the USA TODAY Snapshot, "Is leisure time really shrinking?" into two scatter plots and determine the quadratic model for each scatter plot. They determine if these graphs intersect and learn the concept...
Curated OER
Is There Liquid Water on Mars?
Students assess whether there is liquid water on Mars by analyzing images and data. In this planetary lesson students analyze temperature and pressure graphs and hypothesize about how water could have flowed on Mars.
Curated OER
Weather Tracking
Second graders use the internet to locate weather reports. They present data collected to the class through poster presentation. They read aloud the book Cloudy with a Chance of Meatballs by Judi Barrett and answer questions about...
Curated OER
Flipping Coins: Density as a Characteristic Property
Young scholars explore linear functions in a crime solving context. They collect and analyze data using linear equations, then interpret the slope and intercepts from a linear model.
Curated OER
Conducting a Scientific Investigation
Learners investigate a possible health problem in the local school district through inquiry into attendance records, activities, maps, graphs, and data tables. The simulation continues as solutions for the problem are sought.
Curated OER
Using Excel, the Internet, And Word To Create a Spreadsheet, Chart, And Instructions
Students improve data entry in a spreadsheet.
Curated OER
Genetic Drift
Students use a mathematical simulation of genetic drift to answer questions about the factors that influence this evolutionary process. They run a series of simulations varying allele frequency and population size and then analyze their...
Curated OER
Water Reflections:
Students analyze data from monitoring activities . They summarize, post, and present the data from activities. They tell others in the community what they've learned about local water quality.
Curated OER
What's Down There
Students write an essay about the coral reefs. In this oceanography lesson plan, students investigate the reef of Bonaire and compare it to reefs that are not thriving. Students then explore the differences that contribute to the...
Curated OER
SAFETY KNOWLEDGE BASE CHANGES
Students research and formulate a hypothesis for research to correlate changing safety regulations in regards to personal and environmental safety polices for storage, handling and disposal of chemicals, risk involved in hazardous...


