Alabama Learning Exchange
The World of Integers
Review operations related to rational numbers and integers using the include PowerPoint presentation, "Interesting Integers." Young mathematicians classify rational numbers as being natural, whole, or integers and read an article about...
Chicago Botanic Garden
Weather or Not
What is the difference between weather and climate? This is the focus question of a lesson that takes a deeper look at how weather data helps determine climate in a region. Using weather and climate cards, students decide...
Curated OER
Feature column: Hands on Math With Technology
Young learners will view a math adventures video and practice math concepts. Afterwards they will navigate through Internet sites to participate in teacher selected math adventures. This guide walks you through integrating...
Consumers Energy
The Cost of Electricity
How much is your toaster costing you every day? Young environmentalists calculate the monetary costs of household appliances based on their average consumption of wattage.
Mathematics Assessment Project
Optimizing Coverage: Security Cameras
Are you being watched? Class members determine where to place security cameras protecting a shop. They then evaluate their own and several provided solutions.
Curated OER
Modeling the Electromagnetic Spectrum
Learners construct a model of an electromagnetic spectrum using play-doh and string. They use exponents and plot the radio/microwave, infrared, and visible bandwidths of the spectrum.
Curated OER
Do You Feel Lucky?
Students explore probability by using games based on probable outcomes of events. They name all of the possible outcomes of an event and express the likelihood of such an event occurring.
Curated OER
Guess My Shape
Learners play a game with shapes. They work in groups to identify the names and characteristics of various shapes. They give each other clues to see if others can identify the shape being described. This is a great hands on activity.
National Security Agency
Partying with Proportions and Percents
Examine ratios and proportions in several real-world scenarios. Children will calculate unit rates, work with proportions and percentages as they plan a party, purchase produce, and take a tally. This lesson plan recommends five...
EngageNY
Multiplying and Dividing Expressions with Radicals
That's radical! Simplifying radicals may not be exciting, but it is an important skill. A math lesson provides explanations of properties used throughout the material. Scholars practice skills needed to multiply and divide...
Rochester Institute of Technology
Skateboard Assembly - Line Balance
Utilize the instructional activity on utilization. The second installment of a nine-part technology/engineering series teaches scholars about the flow of a balanced assembly line and the definition of utilization. Videos, activities, and...
Virginia Department of Education
Scientific Notation
Writing a number is all in the notation. The resource introduces the class to scientific notation. Pupils learn the process of taking a very large or small number in standard form and write it in scientific notation. To practice,...
Illustrative Mathematics
Art Class, Assessment Variation
Play with paint and decide the ratio to make different shades of green. When mixing paint colors, your painters should decide which ratios make the same shade and what is needed to mix other ratios for a different shade of green. This is...
Curated OER
Roll a Decimal
Third graders take turns rolling the die, and selects an appropriate place to put the digit that was rolled in order to create a number with the largest value possible. They compete by trying to roll the highest valued number with the die.
Pennsylvania Department of Education
Problem Solving by Using Multiplication to Solve Division Problems
Students use index cards, counting cubes, and their own understanding to identify how division problems can be solved by using multiplication. In this division lesson plan, students use their multiplication skills to solve division...
Curated OER
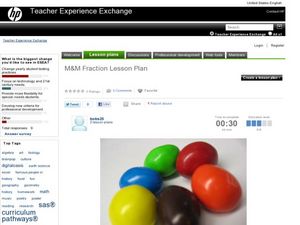
M&M Ratios
Third graders explore ratios. In this probability lesson plan, 3rd graders sort and count M&M's and identify the ratios of different colors. Students use the attached worksheet as an assessment.
Curated OER
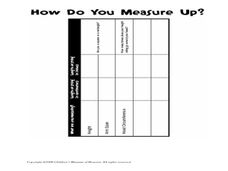
How Do You Measure Up?
Students measure their body. In this measurement lesson plan, students use a string to measure their height and the circumference of their head. They record this information on the worksheet provided and answer questions as a group.
Curated OER
Horatio's Ratios
View a PBS video entitled Horatio's Drive and explore Horatio's Ratios. Collaborative learners form groups to use Mapquest to determine distances covered. They generate the mathematical averages, ratios, and rates in order to calculate...
Curated OER
A Statistical Study of the Letters of the Alphabet
Students gather appropriate information for simple statistical analysis. Then they will calculate probability working with a piece of literature that makes this lesson ideal for teaching across the whole curriculum.
Curated OER
Introducing the Concept: Rates
Sixth graders explore rates as a specific type of ratio, using visual examples of unit rates and unit prices to increase comprehension. They also practice solving problems that are modeled by the instructor. The well-scripted lesson plan...
Curated OER
Schoolyard Bird Project
Students observe and count bird sightings around their schoolyard throughout the school year.
Curated OER
A Slice of Pi
Math pupils, by viewing a video, discover the history of pi and some of the applications of its uses in the world today. They conduct an experiment by measuring the diameter and circumference of various circular objects to calculate...
Curated OER
One Size Fits All, Part 1
Can you tell how tall someone is just by looking at their feet? In this activity, young mathematicians measure their height, arm span, and foot size, graph their findings, and answer questions about how these measurements are related....
Curated OER
Graphing Our Marbles
Students collect information pertaining to marble colors found in their bag; then creating a spreadsheet in order to make a chart representing their findings using Microsoft Excel. Students will present their results to small groups.


