Mathematics Vision Project
Connecting Algebra and Geometry
Connect algebra and geometry on the coordinate plane. The eighth unit in a nine-part integrated course has pupils develop the distance formula from the Pythagorean Theorem. Scholars prove geometric theorems using coordinates including...
Mathematics Vision Project
Module 4: Linear and Exponential Functions
Sequences and series are traditionally thought of as topics for the pre-calculus or calculus class, when learners are figuring out how to develop limits. But this unit uses patterns and slopes of linear functions in unique ways to bring...
EngageNY
Motion Along a Line – Search Robots Again
We can mathematically model the path of a robot. Learners use parametric equations to find the location of a robot at a given time. They compare the paths of multiple robots looking for parallel and perpendicular relationships and...
Shodor Education Foundation
Multiple Linear Regression
You'll have no regrets when you use the perfect lesson to teach regression! An interactive resource has individuals manipulate the slope and y-intercept of a line to match a set of data. Learners practice data sets with both positive and...
Balanced Assessment
All Aboard
Pupils must graph the location of a train using the time given a timetable. They analyze the different legs of the trip, graph the return trip, and compare the two graphs. The lesson ends with a discussion of similarities and differences...
Curated OER
Mine Shaft Grade 8 Slope
Eighth graders investigate slopes using real life scenario. In this algebra instructional activity, 8th graders model and interpret real life data. They plot their data in a coordinate plane and discuss the results with the class.
College Board
2006 AP® Calculus AB Free-Response Questions
Develop more than just a topical approach to the exam. The six free-response questions from 2006 reveal how the AP exam assesses topics. By using the questions, pupils practice topics such as velocity, sketch slope fields, solving...
Curated OER
Rocketsmania And Slope
Learners use a professional basketball team's data and graph it on a coordinate plane. They draw a line of regression and finding its equation. They access a website containing statistics for the Houston Rockets basketball team to solve...
BW Walch
Creating and Graphing Linear Equations in Two Variables
This detailed presentation starts with a review of using key components to graph a line. It then quickly moves into new territory of taking these important parts and teasing them out of a word problem. Special care is taken to discuss...
Curated OER
Graphs and Functions
Middle schoolers describe plotting functions on the Cartesian coordinate plane. They solve functions on paper and using an online tool to plot points on a Cartesian coordinate plane creating lines and parabolas.
Curated OER
Linear Regression and Correlation
Learners explore scatter plots. For this linear regression lesson, groups of pupils graph scatter plots and then find the line of best fit. They identify outliers and explain the correlation. Each group summarizes and shares their...
Curated OER
A Day at the Beach
Help learners determine the rate of change for the temperature of sand. They will collect data on the temperature of wet and dry sand over time with a heat lamp overhead. Then make a scatter plot of the data and find a linear model to...
CK-12 Foundation
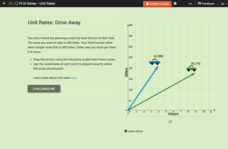
Comparison of Unit Rates: Drive Away
Five questions make up an interactive that challenges mathematicians to compare unit rates. Word problems question scholars about two friends going on a road trip. Scholars manipulate two cars on a coordinate plane to help solve word...
EngageNY
Exponential Growth—U.S. Population and World Population
Show how exponential growth can look linear. Pupils come to understand the importance of looking at the entire picture as they compare the US population to the world population. Initially, the populations look linear with the same rate...
Kenan Fellows
Man vs. Beast: Approximating Derivatives using Human and Animal Movement
What does dropping a ball look like as a graph? An engaging activity asks learners to record a video of dropping a ball and uploading the video to software for analysis. They compare the position of the ball to time and calculate the...
NASA
Ascent: 50 Seconds to MECO
All systems go! With a video and a Google Earth tour as background, pairs investigate two graphs. The graphs display acceleration vs. time and velocity vs. time of a space shuttle launch. Using graphing calculators, the pairs take a...
Charleston School District
Pre-Test Unit 4: Linear Funcitons
Let your classes show you what they know! Use this pre-test to assess the current knowledge of your learners. The assessment includes all pre-algebra concepts related to functions: writing and graphing linear relationships, comparing...
Balanced Assessment
Sharp-Ness
Transform pupils into mathematicians as they create their own definitions and formulas. Scholars examine an assortment of triangles and create a definition and formula for determining the sharpness of the vertex angle. The groups of...
PBS
The Lowdown — Poverty Trends: What Does It Mean to Be Poor in America?
Here's a resource that's rich with learning opportunities. Future mathematicians investigate the poverty rate in America over time. They use an interactive to compare the poverty rate during the Great Recession of 2008 to other years,...
Flipped Math
Calculus AB/BC - Using the Mean Value Theorem
At some point the rate of change must be the average. Pupils first see the definition of the Mean Value Theorem and hear an explanation of it in simple terms. The helpful video then compares the Mean Value Theorem with the Intermediate...
Curated OER
Using a Multi- Sensory Approach
Learners identify the slope of a line given two points on the line. In this algebra lesson, students solve linear equations by finding and comparing slopes of lines. They differentiate between the steepness of the slope and the line.
Curated OER
Balloons and Kites
Students examine a line of points through its slope. They plot points using sticky notes of a balloon's movement amd determine the slope of the lines plotted.
Curated OER
Compare and Contrast
Learners graph equations using the y-intercept. In this algebra lesson, students investigate functions based their slope and y-intercept. They learn to analyze graphs by comparing the y-intercepts of the graphs.
Mathematics Assessment Project
Comparing Lines and Linear Equations
Scholars first complete an assessment task on writing linear equations to model and solve a problem on a running race. They then take part in a card matching activity where they match equations and graphs of lines to diagrams of fluid...


