Curated OER
Math, Calories and You
Discover the connection between calories and weight. Pupils multiply their body weight times calorie estimates for various physical activities to calculate calories burned per minute and per hour. Worksheets a well as website links are...
Curated OER
Nutrients by the Numbers
Students read and discuss an article on the amount of sugar in various food products. They compare the nutritional values of food products, calculate their daily intake of nutrients, analyze serving sizes, and compare/contrast their own...
Curated OER
Food Type And Calories Per Square Meter
Young scholars compare the efficiency of producing food calories in different types of food then calculate how much land is required to supply their food for a year. They then graph the results.
Curated OER
Fast Food Fun
Learners use technology to input, retrieve, organize, manipulate, evaluate, and communicate information to find calories and fat in a typical fast food meal. They decide which fast food restaurant you would like to visit and click on...
Curated OER
The Energy that Keeps Us Moving
Students measure the calorie content of food. In this technology lesson, students explore where the CEENBoTs get the energy to make it move. They create a Venn diagram showing the differences of energy in food and CEENBoTs.
Curated OER
Popcorn Nutrition
Students read a snack nutrition chart and answer questions. They compare nutrition levels of snack foods. They correctly calculate differences in nutritional value.
Curated OER
Data and Probability: What is the Best Snack?
In this math/nutrition lesson, the nutritional value of 3 snack foods is recorded on a data chart and represented on a bar graph. Students analyze and compare information, construct data charts and related bar graphs, and draw...
Kenan Fellows
How Does an Unhealthy Diet Influence our Health and Well-Being?
You are what you eat, or so they say! After surveying family and friends on a week of eating habits, learners analyze the data for patterns. They compare different variables such as fats and cost, fats and calories, or fats and LDLs.
Curated OER
Ratios, Rates, Percent and Nutrition
Examine food labels to determine percentage of fat and sugar to total calories with middle schoolers. Daily nutritional guidelines are discussed and learners will decide how well their foods fit into a healthy diet. In the provided...
EngageNY
Sampling Variability in the Sample Proportion (part 1)
Increase your sample and increase your accuracy! Scholars complete an activity that compares sample size to variability in results. Learners realize that the greater the sample size, the smaller the range in the distribution of sample...
Curated OER
Making Healthy Food Choices
In this well-designed nutritional activity, students are given the opportunity to create their own daily food record, compare their nutrient with minimimun requirements, and think critically about their own food choices. Materials and...
Curated OER
Connect Walking with Mathematics
Examining walking strides, rates, and calories burned are just some of the ways to connect physical education with math.
Yummy Math
Which is the Best Deal on Candy?
Buying enough candy for trick-or-treaters without spending a lot of money can be the ultimate Halloween trick. Middle schoolers solve two holiday-themed word problems to determine which brand of candy is the better deal, based on cost...
Curated OER
Comparing Candy Bars
Eighth graders identify that a ratio is a comparison of two numbers and that a proportion is an equation that equates two ratios. They identify the extremes and means of proportions, as well as the product of the extremes equals the...
Curated OER
Easter Bar Graph - (B)
In this math review instructional activity, students complete addition, subtraction, multiplication, and division problems and put their answers into a bar graph that represents calories. Students complete 13 problems and 1 graph.
Curated OER
An Introduction to Data Reading and Computations
Students discover data reading and computations. In this math lesson plan, students collect nutritional data about intakes of certain foods compared with daily recommended allowances. Students create their own data charts based on their...
Curated OER
Representing Rational Numbers
Seventh graders explore rational numbers. In this fractions, decimals, and percents lesson plan, 7th graders identify and compare equivalencies between fractions, decimals, and percents. Students use hands-on activities to investigate...
Curated OER
Representing Fractions, Decimals, and Percents
In this fractions, decimals, and percents lessons, students explore various methods of representing fractions. They demonstrate situations that represent rational numbers. Students create a foldable exploring fractions, decimals and...
Curated OER
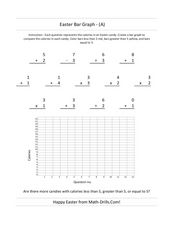
Easter Bar Graph- A
In this Easter math worksheet, students first solve 13 problems with addition, subtraction, multiplication and division. Using the answers, students make a bar graph.
Curated OER
Easter Bar Graph - C
In this math review worksheet, students complete addition, multiplication, division, and subtraction problems where each answer is inserted into a bar graph. Students complete 13 problems.
Curated OER
Easter Bar Graph - (E)
In this math review worksheet, students complete addition, multiplication, division, and subtraction problems where each answer is put into an Easter bar graph. Students complete 13 problems.
Curated OER
Easter Bar Graph - (D)
In this math review learning exercise, students complete addition, multiplication, division, and subtraction problems where each answer is put into an Easter bar graph. Students complete 13 problems.


