Utah Education Network (UEN)
Linear Graphs Using Proportions and Rates
Using a TI-73 or other similar graphing calculator middle school math majors investigate the linear relationship of equivalent proportions. After a brief introduction by the teacher, class members participate in a timed pair share...
Curated OER
Money: Bucks, Banks, and Business
Put economics and currency exchange rates into a real-world application kids can understand. They'll compare bus fares from various cities around the world. Each child selects three international cities to research. They determine the...
University of Colorado
Distance = Rate x Time
Every year, the moon moves 3.8 cm farther from Earth. In the 11th part of 22, classes use the distance formula. They determine the distance to the moon based upon given data and then graph Galileo spacecraft data to determine its movement.
Curated OER
A Day at the Beach
Help learners determine the rate of change for the temperature of sand. They will collect data on the temperature of wet and dry sand over time with a heat lamp overhead. Then make a scatter plot of the data and find a linear model to...
Curated OER
Comparing Countries
Students compare facts about different countries. In this comparing lesson, students collect information about the US and another country and compare them. Students locate countries on the map and make a hypothesis about the lives of...
Federal Reserve Bank
The Story of the Federal Reserve System
Prevent the Federal Reserve System from becoming a dry topic for your middle and high schoolers by using an informative, engaging resource! The cartoon takes your class on a journey with aliens from the planet of Novus to observe the...
American Chemical Society
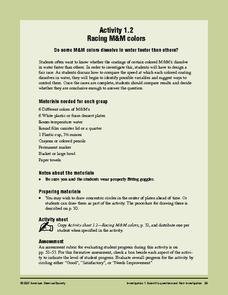
Racing M&M Colors
More than anything, this is great practice in scientific inquiry. After discovering that the color coating of an M&M® dissolves in water during a preceding activity, investigators now question whether or not the color makes a...
Inside Mathematics
Squares and Circles
It's all about lines when going around. Pupils graph the relationship between the length of a side of a square and its perimeter. Class members explain the origin in context of the side length and perimeter. They compare the graph to the...
California Education Partners
Animals of Rhomaar
Investigate the growth rates of alien animals. Pupils study fictional animals from another planet to determine how much they grow per year. The investigators plot the growth of their animals over a period of time and then compare...
McGraw Hill
Metric Units of Weight and Volume
Getting the right measurements can save a lot of time and money in the real world. Learners are introduced to unit conversion and how to accurately go from one unit to another. The first pages are notes and then the packet finishes with...
Curated OER
Comparing Exponentials
Growing money exponentially is the context of this scenario that asks learners to compare investments in two certificate of deposit accounts. Your young investment analysts will learn about the exponential characteristics of money...
Alabama Learning Exchange
How Big Can a Bee Be?
Mathematicians analyze the relationships between surface area and volume. They conduct Internet research, conduct various experiments, record the data in a spreadsheet, and graph the results and compare the rate of increase of surface...
Curated OER
Data Comparison And Interpretation: North Korea, South Korea, And the United States
Ninth graders brainstorm "what they know about North Korea and South Korea." They determine the approximate distance from the United States to North and South Korea and create a graph comparing the birth rates, death rates, infant...
Curated OER
Rainforest Unit
Students investigate the Rainforest. In this Rainforest lesson, students research magazines, journals and the Internet to create a "Save the Rainforest" slogan. Students will record local rainfall amounts and create a graph comparing...
Curated OER
Calculating rates
In this Algebra I/Algebra II activity, students solve verbal problems in which they calculate rates using the appropriate unit of measure. The one page activity contains a combination of seven multiple choice and free response...
Curated OER
What's the Price?
Fourth graders learn about price and comparative shopping. In this price and comparative shopping lesson, 4th graders read Amy Axelrod's, Pigs Go To Market: Fun with Math and Shopping. They use the book to investigate the meaning of...
Curated OER
Gifts for Valentine's Day
Students calculate unit cost. In this gifts for Valentine's Day lesson, students examine store ads and determine the unit cost of Valentine's gifts such as the price for one piece of candy. They compare prices and determine...
Rational Number Project
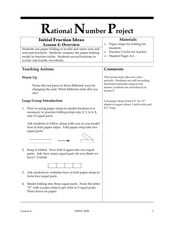
Initial Fraction Ideas Lesson 4: Overview
First-time fraction fiends make paper-folding models for unit and non-unit fractions. They follow teacher-led directions to make models that show 2, 3, 4, 6, 8, and 12 equal parts. An array of fraction review worksheets are...
Curated OER
Shots, Standings, and Shopping
Rates and ratios can easily be applied to real-world situations. Learners explore a series of websites in order to procure comparable data. They define ratios and rates, view videos, and use the internet to explore how ratios and rates...
BW Walch
Creating Linear Equations in One Variable
The example of two travelers meeting somewhere along the road has been a stereotypical joke about algebra as long as algebra has existed. Here in this detailed presentation, this old trope gets a careful and approachable treatment....
Federal Reserve Bank
Lesson 3: A Fresh Start
The members of your economics class may be busy earning graduation credits, but the credit they should be concerned about is their financial credit. The third lesson in a unit about Hurricane Katrina and other events that can result in...
Curated OER
Use Google Maps to Teach Math
Capture the engagement of young mathematicians with this upper-elementary math lesson on measuring time and distance. Using Google Maps, students first measure and compare the distance and time it takes to travel between different...
PBS
Color Code
Don't let your brain play tricks on you! Learners test brain reaction rates while it is receiving multiple stimuli. They time each other reading a set of color words written in different colors and again when they are written in black....


