Physics Classroom
Position-Time Graphs - Conceptual Analysis
Increasingly, colleges and employers want applicants with strong conceptual analysis skills, so give them some practice! Applying these skills to position-time graphs encourages synthesis of knowledge. To complete an installment of a...
Curated OER
Conceptual Analysis in Economics
Help develop assertive, critical-thinking skills that enhance growth and change while teaching economics. In groups, select a topic from a list and then discuss the pros and cons of each topic. Debate why advertising is necessary to our...
National Wildlife Federation
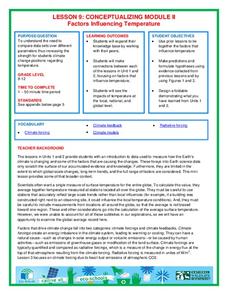
Conceptualizing Module II - Putting It All Together
"Creativity is just connecting things." - Steve Jobs. After weeks of researching climate change, the ninth lesson in a series of 21 combines the data and analysis to address essential questions. It covers natural phenomenon, human...
California Education Partners
Colorful Data
Scale up your lessons with a performance task. Young data analysts work through an assessment task on scaled bar graphs. They answer questions about a given scaled bar graph on favorite colors, analyze a bar graph to see if it matches...
Curated OER
Conceptual Analysis in Economics
Learners practice critical thinking skills by defending their beliefs orally in a "hot seat". In addition, they communicate their feelings about an inssue in writing.
Curated OER
Lesson Plan: My Space
Everyone has a special, personal space; here kids will create a collage that reflects that space. They analyze the painting Soup Tureen and Apple, review two poems, and then conceptualize a personal space through art.
EngageNY
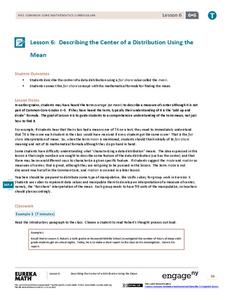
Describing the Center of a Distribution Using the Mean
Everyone does their fair share. The sixth segment in a 22-part unit presents the mean as a fair share. Groups build a conceptual understanding of the mean of a data set, rather than simply learn an algorithm. Learners use the...
Inside Mathematics
Population
Population density, it is not all that it is plotted to be. Pupils analyze a scatter plot of population versus area for some of the states in the US. The class members respond to eight questions about the graph, specific points and...
Curated OER
Mathemafish Population
It's shark week! In this problem, young mathematically minded marine biologists need to study the fish population by analyzing data over time. The emphasis is on understanding the average rate of change of the population and drawing...
Curated OER
Conceptual Art
Students explore the different ways language is used in conceptual art. In this conceptual art lesson, students analyze artworks that emphasize ideas over form and the methods used in conceptual art. Students work in pairs to read and...
Curated OER
Crazy for Cubes: Art and Science
Learners discuss Sol LeWitt and conceptual art, then analyze the differences in expressing a concept through model-based inquiry and aesthetic art criticism. They develop a geometric, scientific, or mathematical concept, then create an...
Curated OER
Wacky Water World: Student Worksheet
This well-designed math worksheet invites learners to work in pairs in order to determine which plan is the better value when going to an amusement park. Plan A and Plan B each have different admission fees, and different rates per ride....
Curated OER
Redistricting: Drawing the Lines
Difficult redistricting concepts are covered in a context that will make it understandable to your government scholars. They begin with a KWL on the term redistricting and then watch a video to answer some questions. They analyze...
Alabama Learning Exchange
Tiger Math Graphing
Learners practice various skills using the book Tiger Math: Learning to Graph from a Baby Tiger. After listening to the story, they create a pictograph using data collected from the text. They also color a picture of a tiger, collect...
Curated OER
Interpreting Political Cartoons in the History Classroom
Students analyze political cartoons. In this historical perspectives lesson, students use the provided cartoon analysis worksheet to examine the political cartoons that their instructor shares with them.
Inside Mathematics
Snakes
Get a line on the snakes. The assessment task requires the class to determine the species of unknown snakes based upon collected data. Individuals analyze two scatter plots and determine the most likely species for five additional data...
PBS
Conceptualizing an Experiment
Students analyze information from a variety of sources in order to create a hypothesis about the origin of an interesting family artifact. They create alternative hypotheses based upon available information in order to understand that...
Curated OER
Time Conceptualization
Students use this activity to establish a new mode of reference to the conceptualization of time. To present hominid evolution in terms of millions of years and endosymbiosis of eukaryotes in billions of years carries little meaning to...
Curated OER
Conceptualizing an Experiment
Learners work together to design an experiment. They discover the origin of a family artifact. They analyze the data and discuss the results. They determine if the experiment is the best way to find out this type of information.
Curated OER
Unexpected Answers
Students explore the concept of fairness. In this fairness lesson, students play four probability games. Students determine who has the best chance of winning each of the four games. Students discuss which games gave an unfair advantage.
Education Development Center
Creating a Polynomial Function to Fit a Table
Discover relationships between linear and nonlinear functions. Initially, a set of data seems linear, but upon further exploration, pupils realize the data can model an infinite number of functions. Scholars use multiple representations...
Curated OER
Operation Spaghetti
Find the math in recipes. Young chefs will follow a recipe and investigate the total cost for materials. They measure amounts of food necessary for the recipe and compute the per person cost.
Education Development Center
Interpreting Statistical Measures—Class Scores
Explore the effect of outliers through an analysis of mean, median, and standard deviation. Your classes examine and compare these measures for two groups. They must make sense of a group that has a higher mean but lower median compared...
Curated OER
Lesson: Paul Chan: "Score for the 7th Light"
Music, art, and poetry coalesce in a single exhibition, and in a single lesson. Critical thinkers analyze the Fluxus art movement as it's seen in the work of Paul Chan's 7 Lights. They consider the use of poetry and music in his work,...


