EngageNY
Why Do Banks Pay YOU to Provide Their Services?
How does a bank make money? That is the question at the based of a activity that explores the methods banks use to calculate interest. Groups compare the linear simple interest pattern with the exponential compound interest pattern.
International Technology Education Association
Tidy Up Those Sloppy Force Fields!
It is just magnetic. This resource presents the concept of Earth's and another planet's magnetic field and how spacecrafts detect them. Learners study a problem using magnetometers and participate in three experiments to come up with a...
EngageNY
Bean Counting
Why do I have to do bean counting if I'm not going to become an accountant? The 24th installment of a 35-part module has the class conducting experiments using beans to collect data. Learners use exponential functions to model this...
Mathematics Vision Project
Module 3: Polynomial Functions
An informative module highlights eight polynomial concepts. Learners work with polynomial functions, expressions, and equations through graphing, simplifying, and solving.
Noyce Foundation
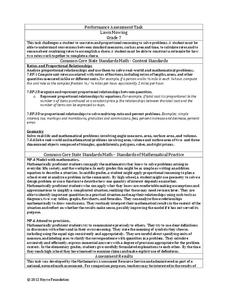
Lawn Mowing
This is how long we mow the lawn together. The assessment requires the class to work with combining ratios and proportional reasoning. Pupils determine the unit rate of mowers and calculate the time required to mow a lawn if they work...
National Energy Education Development Project
Great Energy Debate
If someone yelled for eight years and eight months, they could produce enough energy to heat one cup of coffee. A lesson on energy encourages scholars to research 10 different energy sources in groups before playing a game. Twenty...
National Energy Education Development Project
Exploring Oil and Gas
The United States consumes more oil than any other country, about 1.85 billion barrels (or 77 billion gallons) a day. Viewers learn about the history of fossil fuel exploration and how they are formed in an informative presentation. They...
National Energy Education Development Project
Energy Works: Yes, Indeed it Does!
Moving from its definition to how it moves and its different types, scholars see different examples and then move into its application and use in everyday lives, in an energy-based presentation.
Inside Mathematics
Swimming Pool
Swimming is more fun with quantities. The short assessment task encompasses finding the volume of a trapezoidal prism using an understanding of quantities. Individuals make a connection to the rate of which the pool is filled with a...
Inside Mathematics
Conference Tables
Pupils analyze a pattern of conference tables to determine the number of tables needed and the number of people that can be seated for a given size. Individuals develop general formulas for the two growing number patterns and use them to...
Inside Mathematics
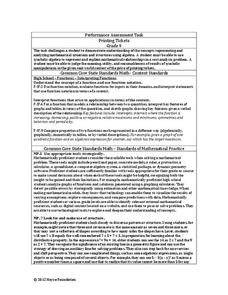
Printing Tickets
Determine the better deal. Pupils write the equation for the cost of printing tickets from different printers. They compare the costs graphically and algebraicaly to determine which printer has the best deal based upon the quantity of...
Noyce Foundation
Truffles
Knowing how to scale a recipe is an important skill. Young mathematicians determine the amount of ingredients they need to make a certain number of truffles when given a recipe. They determine a relationship between ingredients given a...
EngageNY
Solving General Systems of Linear Equations
Examine the usefulness of matrices when solving linear systems of higher dimensions. The lesson asks learners to write and solve systems of linear equations in four and five variables. Using matrices, pupils solve the systems and apply...
Inside Mathematics
Squares and Circles
It's all about lines when going around. Pupils graph the relationship between the length of a side of a square and its perimeter. Class members explain the origin in context of the side length and perimeter. They compare the graph to the...
Iredell - Statesville Schools
Direct and Inverse Variation Worksheet
Provide learners with a worksheet that provides problems that focuses on direct and inverse variations, proportional relationships, graphing, and word problems. The goal is to find the outcome and decide what type of variation the...
EngageNY
Translating Graphs of Functions
If you know one, you know them all! Parent functions all handle translations the same. This lesson examines the quadratic, absolute value, and square root functions. Pupils discover the similarities in the behavior of the graphs when...
PHET
CME Plotting
Young scientists build on their previous knowledge and apply it to coronal mass ejections. By plotting the path of two different coronal mass ejections, they develop an understanding of why most don't collide with Earth.
Inside Mathematics
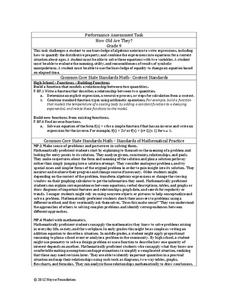
How Old Are They?
Here is a (great) lesson on using parentheses! The task requires the expression of ages using algebraic expressions, including the distributive property. Pupils use their expressions to determine the individual ages.
NOAA
Exploring Potential Human Impacts
Arctic sea ice reflects 80 percent of sunlight, striking it back into space; with sea ice melting, the world's oceans become warmer, which furthers global warming. These activities explore how humans are impacting ecosystems around the...
Balanced Assessment
On Averages and Curves
Determine the average on a curve. The class finds graphical representations of averages and expresses them both symbolically and on the graph. The assessment requires class members to justify using average to describe graphs.
Balanced Assessment
Local and Global Behavior
Create rules for numerical sequences. Pupils develop local rules and recursive rules for number sequences. The sequences are linear, quadratic, and cubic in nature. Scholars find that some local rules do not work, no matter where in the...
EngageNY
Graphs of Functions and Equations
Explore the graphs of functions and equations with a resource that teaches scholars how to graph functions as a set of input-output points. They learn how the graph of a function is the graph of its associated equation.
EngageNY
Comparing Linear Functions and Graphs
How can you compare linear functions? The seventh installment of a 12-part module teaches learners how to compare linear functions whose representations are given in different ways. They use real-world functions and interpret features in...
EngageNY
Graphs of Simple Nonlinear Functions
Time to move on to nonlinear functions. Scholars create input/output tables and use these to graph simple nonlinear functions. They calculate rates of change to distinguish between linear and nonlinear functions.
Other popular searches
- Constant Velocity
- Constantinople
- Constant Rate of Change
- Constant Speed
- Constant Acceleration
- Constant Perimeter
- Constant Rate
- Constant Area
- Equilibrium Constant
- Constant of Variation
- Constant Term
- Constant of Proportionality


