Curated OER
Grid it, Map it
Students participate in designing a city layout using grids and coordinates. They work on a city space and create a grid on a life size layout on the gym floor.
Curated OER
Critter Encounter Chart
Students record data found at an assigned web site. In this data collection lesson plan, students access an assigned web site in order to complete a data chart about animals they see. They travel to different sections of the web site to...
Curated OER
"Mummies--The Great Cover Up"
Students wrap their mummy, use canopic-style jars for the preserved chicken organs and design and decorate a sarcophagus. They collect data by weighing, measuring and graphing their "mummy" and its organs.
Curated OER
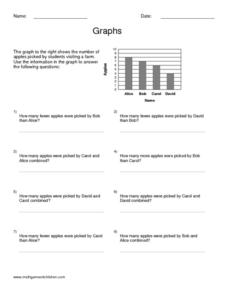
Graphs
In this algebra instructional activity, students calculate the point of intersection between a circle and a straight line. There are 5 questions with an answer key.
Curated OER
Rocket Riot
Students form "companies" of 3-4 students and build bottle rockets for analysis and experiment. This lesson plan uses NASA's RcketModeler Version 1.2 rocket simulator to evaluate each rocket's flight.
Curated OER
Mush! Tracking Travelers on the Trail
Students get to know Alaska and the Iditarod route that is run by dogs as they track the mushers' progress on a map that they create specifically for the race. They learn about latitude, longitude, plotting on a map, checkpoints, and...
Curated OER
Who's got the fastest legs?
Students use a stopwatch to collect information for a scatterplot. In this fastest legs lessons, students collect data through the taking of measurements, create and find a median number. Students develop an equation and answer...
Curated OER
Making Metric And Customary Rulers
Students create a ruler for the purpose of measurement using the standard and metric systems. The rulers are of different lengths and are compared to one another. Then students make conversions of different lengths using both systems of...
Curated OER
Home on the Range
Students use maps and mathematics to determine the appropriate panther population in a given area. In this Florida ecology lesson, students research the area requirements of male and female panther and use a map to help calculate how...
Curated OER
Got Milk?
Students measure the angles of a milk carton. They identify and label acute, right, and obtuse angles. Using appropriate tools, students determine the volume of a cube or a rectangular prism. Students complete worksheets to...
Curated OER
Interior Designer for a Day
Seventh graders organize a 20 x 17 room with a given set of furniture pieces. Arrangement is to be based on maximum comfort and practicality. This lesson is a good way to teach and reinforce the mathematical concept of area.
Curated OER
What Can You Learn From A Mealworm?
High schoolers collect data from mealworms. In this science and math lesson plan, students gain an understanding of collecting metric data using mealworms.
Curated OER
Linear Equations
Students solve linear equations by modeling. In this algebra instructional activity, students solve one and two step inequalities and equations. They use manipulative to create a visual of the steps.
Curated OER
Computer Graphing
Students research the Internet or create surveys to find graphable data. They collect, organize, analyze and interpret the data. Finally, they choose the appropriate type of graph to display the data and find the measures of central...
Curated OER
Graphing Favorite Holidays
Students create spreadsheets and bar graphs based on results of survey of favorite holidays.
Curated OER
Box And Whiskers
Students investigate the concept of using box and whisker plots. They demonstrate how to use them to compute median, mode, and range. Students compare and contrast the complete and systematic processes use to solve problems. This is done...
Curated OER
Analyzing Country Data
Young scholars analyze different data in percentage form. In this statistics lesson, students plot data using box-plots, dotplot, and histogram. They compare and contrast the collected data using the boxplot.
Curated OER
Irregular Fractals
High schoolers explore the concept of irregular fractals. In this irregular fractals activity, students discuss how to find fractal dimensions through teacher led discussion. High schoolers calculate fractal dimensions of various fractals.
Curated OER
Tangram Perimeters
Students work together to make figures out of tangram squares. In groups, they calculate the measurements they need and apply the Pythagorean Theorem. They complete a worksheet solving equations using the theorem and review their answers.


