CK-12 Foundation
Intercepts by Substitution: Finding a Linear Product Using a Quadratic
Discover another way to interpret multiplication. Using an interactive, learners slide points (representing the factors of multiplication) along the x-axis of the graph of y = x^2 and observe changes in the line segment connecting the...
CK-12 Foundation
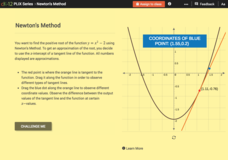
Newton's Method
Use an iterative process to find an approximation of a square root. Pupils use the interactive to find an approximation to find the positive root of a quadratic function with Newton's method. With the graphs, learners position the...
CK-12 Foundation
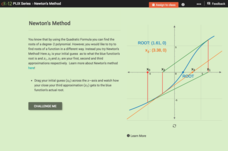
Newton's Method
Does the accuracy of the first guess make a difference down the line? Learners investigate the effects of the iterative process of finding roots, using Newton's Method. By moving the initial guess of a root on a graph, pupils observe the...
101 Questions
Deodorant
Smells like learning! Young scholars collect data on the length of time a stick of deodorant lasts. After modeling the data with a graph and function, they make predictions about deodorant use over time.
EngageNY
The Graph of a Function
Mathematics set notation can be represented through a computer program loop. Making the connection to a computer program loop helps pupils see the process that set notation describes. The activity allows for different types domain and...
Curated OER
Graphing Quadratic Equations
Review the form of a quadratic function, and the parabola it creates. Continue on with the whole group to work through a mini-lab, practicing how to graph quadratic equations with one variable. The goal of this lesson is for the group...
West Contra Costa Unified School District
Introduction to Trigonometric Functions
Scholars first learn the definitions of the sine ratio, the cosine ratio, and the tangent ratio. After mastering these definitions, they use the new information to solve triangles.
Curated OER
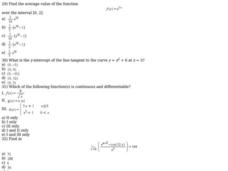
Average Value of a Function
In this calculus activity, 12th graders calculate the line tangent to a curve and find the average value of a function. There are 12 questions.
Virginia Department of Education
Linear Modeling
An inquiry-based algebra lesson explores real-world applications of linear functions. Scholars investigate four different situations that can be modeled by linear functions, identifying the rate of change, as well as the strength and...
Curated OER
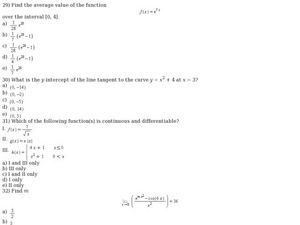
Sixteen Multiple Choice AP Calculus BC Exam Preparation Questions
In this review for Calculus BC exam worksheet, students solve sixteen various multiple choice problems. These problems are designed as review and preparation for the AP Calculus Exam.
Concord Consortium
All-in-All Problems
Graphs, functions, symbols, and more! Use these strategies to model everything from the flow of a river to the number of cars passing a toll booth. Presented differently but solved similarly, learners consider five different scenarios...
EngageNY
Analyzing Residuals (Part 2)
Learn about patterns in residual plots with an informative math lesson. Two examples make connections between the appearance of a residual plot and whether a linear model is the best model apparent. The problem set and exit ticket...
Curated OER
Graphing Linear Equations
Ninth graders review the information that they have already learned
with regard to linear equations and graphical representations. They then assist in combining equations with a graphical element and complete various graphs with this...
Curated OER
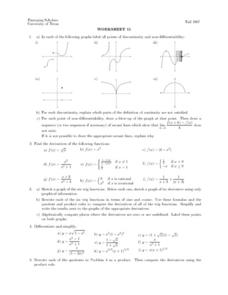
Worksheet 11 - Points of Discontinuity
In this points of discontinuity worksheet, students observe graphs and label them as points of discontinuity and non-differentiability. They identify the derivatives of functions. This one-page worksheet contains five multi-step problems.
Curated OER
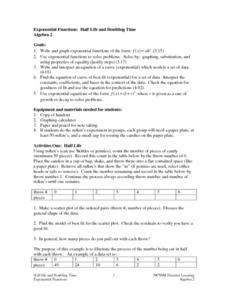
Exponential Functions: Half Life and Doubling Time
High schoolers investigate the concept of exponential functions and how they increase in size over time. They simplify the functions in order to find the solutions that are possible and perform analysis of the curved line that is...
EngageNY
Polynomial, Rational, and Radical Relationships
This assessment pair goes way beyond simple graphing, factoring and solving polynomial equations, really forcing learners to investigate the math ideas behind the calculations. Short and to-the-point questions build on one another,...
West Contra Costa Unified School District
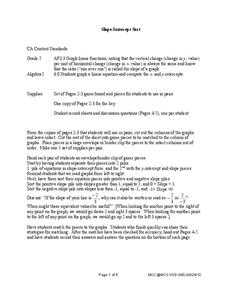
Slope-Intercept Sort
What's so special about slope? Pupils first match cards with slope and y-intercept to graphs of linear equations. They continue the lesson by matching equations in slope-intercept form to the same graphs.
Curated OER
Data Collection and Presentation
Students concentrate on discrete quantiative data. They are shown that the vertical line diagram as a more appropriate way to present discrete quantiative data then bar charts. Students work as a group to help with the interpretation...
Curated OER
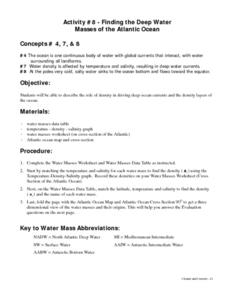
Finding the Deep Water Masses of the Atlantic Ocean
Students describe the role of density in driving deep ocean currents and the density layers of the ocean. They determine that the ocean is one continuous body of water with global currents that interact, with water surrounding all...
Curated OER
Worksheet 27 - Fall 1995
In this math activity, students find the area bounded by the tangent line, the x-axis, and the line x =2. They also describe the graph of the function.
Curated OER
Worksheet 15
In this math instructional activity, students sketch and label on a number line the regions that converge and diverge with the sequences. Then they examine a smooth function and define its series.
Illustrative Mathematics
Fishing Adventures 1
Often inequalities exist in many real-world contexts but young math learners struggle with understanding how to represent that relationship in a simple equation using an inequality. This activity focuses on the basic concepts by using...
Houghton Mifflin Harcourt
Unit 4 Math Vocabulary Cards (Grade 6)
Reinforce math vocabulary with a set of flash cards. Forty-eight cards offer boldly printed words, and their corresponding definition alongside an example with labels. Terms include absolute value, inverse operations, slope, and more!
Radford University
Linear Equations in Real Word Problems
Make up a story about a linear graph. Scholars identify key features of a linear graph, such as intercepts, domain and range, and slope. They then create a word problem that could be represented by the graphed line.


