Curated OER
Bungee M&M's
Eighth graders experiment with M&M's and a cup attached to a spring to to simulate a bungee jump. They graph the results of the experiment and make predictions for continuing the experiment. They determine the "line of best fit."
Curated OER
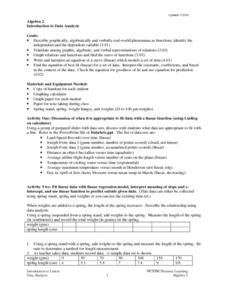
Introduction To Data Analysis
Seventh graders investigate the concept of looking at the data put in a variety of ways that could include graphs or data sets. They analyze data critically in order to formulate some sound conclusions based on real data. Students graph...
Curated OER
Hyperbolas
Students find the center, foci, vertices, and asymptotes of hyperbolas. They graph hyperbolas and determine the equation of a hyperbola with a horizontal transverse axis. They derive general coordinates for the foci of a hyperbola with a...
Curated OER
Cutting Cordwood
Students examine a story problem in which two men are earning money by cutting cords of wood. They use data from graphs to use on a grid. They practice writing algebraic equations as well.
Curated OER
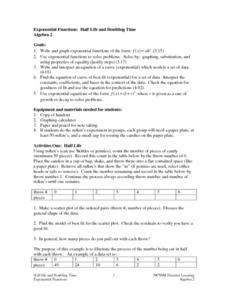
Exponential Functions: Half Life and Doubling Time
Students investigate the concept of exponential functions and how they increase in size over time. They simplify the functions in order to find the solutions that are possible and perform analysis of the curved line that is produced when...
Curated OER
Geographic Effects on Precipitation, Water Vapor and Temperature
Students investigate the factors affecting climate using Live Access Server. In this geography lesson, students graph atmospheric data using Excel spreadsheet. They compare and contrast temperature, precipitation and water vapor of two...
Curated OER
Lines, Rays, Line Segments, and Planes
Students are introduced to lines, rays, line segments and planes and study the differences between them. They also practice graphing lines, rays, line segments and planes
Curated OER
The Genetics of Parenthood
Pupils explore the field of genetics. Through a graphing activity, students assess four common traits. They complete a Meiosis I and II charts which represent possible gametes for an individual. Pupils discuss phenotype and genotype...
Curated OER
Line Best Fit
Students identify the line of best fit. In this statistics lesson, students analyze graphs and plots to identify positive, negative or no correlation. They find the line of best fit for different scatter plots.
Curated OER
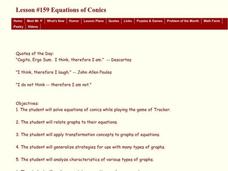
Equations of Conics
Students investigate the graphs of conics. In this Algebra II lesson plan, students solve equations of conics while playing the game of Tracker. In Tracker the graphs are hidden on a coordinate plane and students use probe...
Curated OER
Slope Fields
Students sketch a slope field for a given differential equation, given a slope field. They also match a slope field to a differential equation and match a slope field to a solution of a differential equation. Finally, students use a...
Curated OER
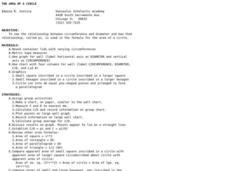
THE AREA OF A CIRCLE
Young scholars examine the relationship between circumference and diameter and how to use the formula to find the area of a circle. In this circle lesson students divide into groups and complete an activity.
Curated OER
High School Mathematics Problems from Alaska: Writing an Equation: Altitude Range vs. Day in Barrow, Alaska
Students answer questions about the altitude range of the sun over time in Barrow, Alaska.
Polar Trec
Playground Profiling—Topographic Profile Mapping
The Kuril islands stretch from Japan to Russia, and the ongoing dispute about their jurisdiction prevents many scientific research studies. Scholars learn to create a topographic profile of a specific area around their schools. Then they...
Curated OER
Maximizing and Minimizing the Area of Rectangles Given a Fixed Perimeter
Students explore the realms of measurement. In this math lesson plan, students analyze and solve problems in which rectangles with identical perimeters are compared to maximize or minimize area. This lesson can be extended for algebra,...
Curated OER
Measurement and the Illampi Mound Colony
Young scholars comprehend the basic units of measurement, scale, plotting, and basic grids. Students practice their estimation
and measuring skills and will demonstrate their ability to work well in groups.
Curated OER
Solar Heating in the Himalayas
A fascinating activity on how solar power is utilized by people who live in the Himalayas is here for you. In it, learners perform a case study which will help them understand that solar energy is a renewable resource, that geography...
Physics Classroom
A Critical Lab
Physics lab groups finagle with laser lights to determine the critical angle of refraction for both water and Lucite. Because there are no detailed steps or an answer key for this enlightening exercise, an inexperienced physics...
Curated OER
Air Pollution in Mexico City
A fantastic lesson on urban air pollution problems throughout the world is here for you. Learners understand that there are many factors involved in creating pollution, that there are many health effects brought on by air pollution, and...
EngageNY
Arithmetic and Geometric Sequences
Arithmetic and geometric sequences are linear and geometric patterns. Help pupils understand the relationship and see the connection with an activity that asks them to write the rules and classify the patterns correctly. A sorting...
Willow Tree
Midpoint and Distance Formulas
The shortest distance between two points is a straight line. Learners use the Pythagorean Theorem to develop a formula to find that distance. They then find the midpoint using an average formula.
Curated OER
Do Two Points Always Determine an Exponential Function?
Algebra learners explore, analyze and build an exponential equation given its form and a specific point that exists on the function in this task. The last question asks learners to apply their ideas to an exponential equation given two...
Willow Tree
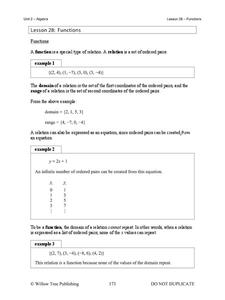
Functions
What makes a function a function? Learn the criteria for a relation defined as a function both numerically and graphically. Once young mathematicians define a function, they use function notation to evaluate it.
Alabama Learning Exchange
The World of Integers
Review operations related to rational numbers and integers using the include PowerPoint presentation, "Interesting Integers." Young mathematicians classify rational numbers as being natural, whole, or integers and read an article about...
Other popular searches
- Coordinate Graphing Pictures
- Holiday Coordinate Graphing
- Graphing Coordinate Planes
- Coordinate Graphing Worksheets
- Cartesian Graphing Pictures
- Coordinate Graphing Art
- Using Coordinate Graphing
- Coordinate Graphing Practice
- Algebra Coordinate Graphing
- Coordinate Graphing Distance
- Graphing Coordinate Pairs
- Graphing on a Coordinate Grid

