Curated OER
North vs. South
Students use information about the Union and Confederate troops to create a bar graph. In this graphing lesson, students graph troop information on a bar graph, color coding the information. Students then find the differences...
Curated OER
Introduction to Dr. Seuss
First graders look at slides on the SMART Board of different facts about Dr. Seuss and then create a class bar graph of their favorite Dr. Seuss books. In this Dr. Seuss lesson plan, 1st graders review and list facts that they learned...
Curated OER
What's the Weather?
Second graders make daily weather observations, record them with appropriate stickers on a chart, and then summarize them at the end of the week in the form of a bar graph.
Curated OER
Pecan Power
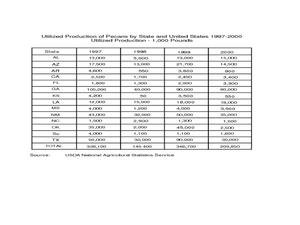
Students study the origins of pecans and complete a bar graph from the data they have discovered. In this pecan lesson plan, students draw pecans, discuss a pecan time line, and draw a bar graph comparing Arizona pecans to other...
Curated OER
Review of the Scientific Method
Students review the Scientific Method with a hands-on activity. Working with a partner, they hypothesize the number of water drops that fit on the heads side of a penny. They collect data and share their results with the remainder of...
Curated OER
Statistical Inquiry
In this statistical inquiry worksheet, students analyze and interpret a variety of diagrams such as a scatter plot, bar graph and pie charts. They create tables and other diagrams to support given data. This two-page worksheet contains 3...
Curated OER
Graphing with Stems-and -Leafs
Fourth graders examine the use of stem and leaf graphs. In this stem and leaf graph lesson, 4th graders participate in teacher led lesson showing the use of the graphs. They work in groups to collect data about peanuts before making a...
Curated OER
Graphing with the Five Senses
Students collect data and record it on a bar graph. In this data graphing lesson, each small group of students is assigned to collect data on one of the five senses. They then practice a song that helps them remember the purpose of each...
Curated OER
BUS: Farming: It's A Fact (Ag)
Students create two different types of graphs from the information in the "Farm Facts" booklet (i.e., bar graph, pie chart, etc.). They calculate where your food dollars are spent (on and off farm).
Curated OER
Line Graphs and Commercial Costs
Students investigate line graphs. In this middle school mathematics lesson plan, students compare and contrast different types of graphs and create line graphs based on the data provided.
Willow Tree
Histograms and Venn Diagrams
There are many different options for graphing data, which can be overwhelming even for experienced mathematcians. This time, the focus is on histograms and Venn diagrams that highlight the frequency of a range of data and overlap of...
Curated OER
Run, Gingerbread Men, Run!—Game
Run, gingerbread men! During the board game, four gingerbread men race to discover which one finishes first. Scholars take note of the game's results using a tally chart and bar graph for all to observe the frequency of the winning...
Curated OER
MAP Practice
In this geometry activity, students create circle, line and bar graphs using different comparisons of events. There are 24 questions with an answer key.
CPO Science
Science Worksheets
If you need an array of worksheets to augment your science lessons, peruse a collection of assignments that is sure to fit your needs. With topics such as metric conversion, the scientific method, textbook features, research skills,...
Radford University
How Is Your Gender Represented?
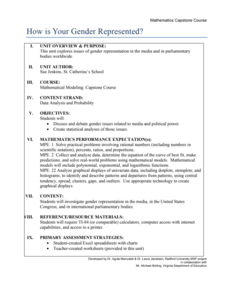
Does the media shape people's views on gender? Scholars use data on gender portrayal in magazines to explore the idea. They use a spreadsheet program to create bar graphs and perform a chi-square test. They also use provided data to...
Curated OER
Graphing Data
Second graders examine how to make and read bar graphs. In this bar graph lesson, 2nd graders compare bar graphs to pictographs by looking at hair color survey data. They practice making a bar graph and finding the range of the data.
Curated OER
Graphs: Favorite Pet Graph
In this graphing worksheet, students use the data from a tally chart to create a bar graph. The graph template is provided, and students fill in the bars.
Curated OER
Graphing Favorite Fruit
Third graders take poll and sort data, enter the data to create a spreadsheet and create bar and pie graphs.
Curated OER
Fairy Tales
Sixth graders explore the elements of fairy tales. In this fairy tales lesson, 6th graders analyze several versions of Cinderella from around the world. Students graph fairy tale elements using Excel and create Venn diagrams comparing...
Curated OER
Creating a Graph
Students brainstorm favorite things to do during the summer. They survey classmates to collect data, arrange it in a chart, and create graphs using ClarisWorks.
Curated OER
5 Sense Bear
Students become familiar with their five senses through the creation of a sense bear. In this five senses lesson, students create a bear and add cinnamon and a candy cane to the bear. Students use their five senses with this...
Curated OER
Applied Science-Science and Math (2A) Post Lab
Second graders create a graph about TV watching. In this bar graph lesson, 2nd graders make a hypothesis about how much TV 2nd graders watch per week. They record their TV watching for a week and bring it to school to create a class...
Curated OER
Travel Fun
In this bar graph worksheet, students survey classmates about their favorite way to travel. Students then fill in one square for each response creating a horizontal bar graph.
Curated OER
Understanding Statistics
In this statistics worksheet, students examine and interpret pictographs and line graphs. Students analyze the provided data in order to create bar graphs, circle graphs, and box and whisker plots. The nine page worksheet accompanies a...


