Curated OER
Using Charts and Graphs to Study East Asia's Modern Economy
Students examine East Asia's modern economy. In groups, classmates use the internet to compare the resources, products, and economy of specified countries. After collecting the data, pupils create charts, tables and graphs. They...
Curated OER
Looking for More Clues
Fifth graders explore how to collect data and display it on a bar and circle graph.
Curated OER
Animals Finding Rice Paddies
Fourth graders examine the animals who live in rice paddies and create a chart. In this rice lesson, 4th graders link the types of animals living in each ecosystem with a bar graph. Students use colored bars to show...
Curated OER
So Fast! So Slow!
Fifth graders give examples of objects that move slow and fast. In this physics instructional activity, 5th graders rank animals according to how quickly they move. They create a bar graph of organisms versus rates of speed.
Curated OER
Biodiversity
Students investigate the diversity of temperate forests and tropical rainforests. They catch and observe local insects, sort leaves and insects on a chart, listen to the book "A Walk in the Rainforest," and create a class bar graph that...
Curated OER
Livelihood of the Times
Students recognize the importance of analyzing historical information and data. For this historical analysis lesson, students collect information for a bar graph, complete a jobs worksheet and define vocabulary.
Curated OER
Graphing Favorite Colors
Third graders collect data and insert it into ClarisWorks to create a spreadsheet/graph of their favorite color. They interpret the data together.
Curated OER
Water: From Neglect to Respect
The goal of this collection of lessons is to make middle schoolers more aware of the ways in which they are dependent upon water to maintain their standard of living. Learners compare water use in Lesotho to water use in the United...
Curated OER
Quarter, Nickel, Dime....
An engaging game called, "Quarter, Nickel, and Dime" is presented in this math lesson. Players are given an envelope with slips of paper that represent the three coins. In pairs, they play the game 18 times, and the whole class charts...
Curated OER
Accidents Happen: Seat Belt Laws, Enforcement, and Usage
Start with a NOVA video about car crashes, crash test dummy footage, or other video about seat belt use. Or have groups review attached data about seat belt usage (by state) and share their conclusions. Learners then devise a method to...
Curated OER
M&M’s Math Worksheet
Who knew you could cover prediction, histograms, fractions, decimals, data collection, and averages (mean, median, and mode) all with a bag of M&M's®? Here's a fantastic set of worksheets to help you make candy a mathematical journey...
Center Science Education
Hurricanes and Climate
Feeling under the weather? This instructional activity on hurricanes can whip things up! With professionally designed maps and handouts, teach your future weathermen (or women) where, when, and how hurricanes occur. They identify...
Curated OER
Surviving AIDS
Enhance your middle and high schoolers' research skills with this lesson. After viewing a video clip about HIV and AIDS, high schoolers identify the facts and issues surrounding the disease. They work together to create a newspaper...
Teach Engineering
Breathing Cells
Pairs work together to determine whether unknown solutions are either acids or bases by using a red cabbage indicator solution. After determining the general pH of the unknown solution, classmates blow into the same indicator after...
Curated OER
Creating and Comparing Climographs
Students are introduced to the importance and usefulness of climographs. In groups, they create a climograph of two cities on about the same latitude. They compare and contrast the locations and climates of the two cities and write a...
Curated OER
Spreadsheet Graphs
Students create graphs using information from spreadsheets. They select a topic from the following choices: website use, digital cameras, spreadsheets, calculators or educational software. They tally the class results and create an...
Curated OER
Toy Dissection Graph
Students explore simple machines and how they are made. They examine the parts of the simple machine and collect information about its parts. Using Excel, students create circle and bar graphs from the collected data.
Shodor Education Foundation
Data Flyer
Fit functions to data by using an interactive app. Individuals plot a scatter plot and then fit lines of best fit and regression curves to the data. The use of an app gives learners the opportunity to try out different functions to see...
Curated OER
Line 'Em Up!
Young scholars find coordinate points on a grid and create a line graph with those points. This lesson should ideally be used during a unit on various types of graphs. They make and use coordinate systems to specify locations and to...
Curated OER
Gummy Bear Picture Graph
First graders investigate picture graphs. In this graphing lesson, 1st graders create a picture graph with the x-axis being number and the y-axis being color. Students sort their gummy bears by color and use pictures of colored bears...
Curated OER
Celebrate Hispanic Heritage Month!
Students use information from the U.S. Bureau of the Census to create a bar graph, a picture graph, or a circle graph showing the country of origin of U.S. Hispanics.
Curated OER
The North (Wall) Star
Young scholars engage in a lesson which shows them that celestial navigation is the art and science of finding one's geographic position by means of astronomical observations, particularly by measuring altitudes of celestial objects -...
Curated OER
Constancy and Change
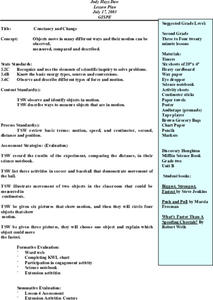
Second graders investigate how objects can move in different ways. They move in different ways across the room and develop a class list of movement words. Students also conduct a measuring motion experiment, create a bar graph for the...
Curated OER
Viruses: Tiny But Deadly
In this viruses worksheet, learners read given information about the effect of viruses on people throughout history. Students create a bar graph comparing the viruses and answer seven questions based on the information they have learned.


