Charleston School District
Graphing Functions
How do letters and numbers create a picture? Scholars learn to create input/output tables to graph functions. They graph both linear and nonlinear functions by creating tables and plotting points.
Charleston School District
Tables of Linear Functions
Don't forget the tables! The previous lessons in this five-part series examined the linear equation and graph relationship. The current lesson adds tables to the mix. At completion, individuals should be able to create a table of values,...
Curated OER
Getting Started with Interactive Math Notebooks
Set young mathematicians up for success with this interactive math notebook. Including a list of rules and expectations for using the notebooks, as well as templates for a creating a cover page and table of contents, this resource...
Towson University
Looking Backwards, Looking Forward
How do scientists know what Earth's climate was like millions of years ago? Young environmental scholars discover how researchers used proxy data to determine the conditions present before written record. Grouped pupils gain experience...
Curated OER
Using Google Docs
This is a fantastic resource for teachers to have in their tool belts upon entering into the world of using Google Docs in the classroom! It is a reference sheet with step-by-step instructions and graphics for everything from basic...
Georgia Department of Education
Analytic Geometry Study Guide
Are you looking for a comprehensive review that addresses the Common Core standards for geometry? This is it! Instruction and practice problems built specifically for standards are included. The material includes geometry topics from...
Other
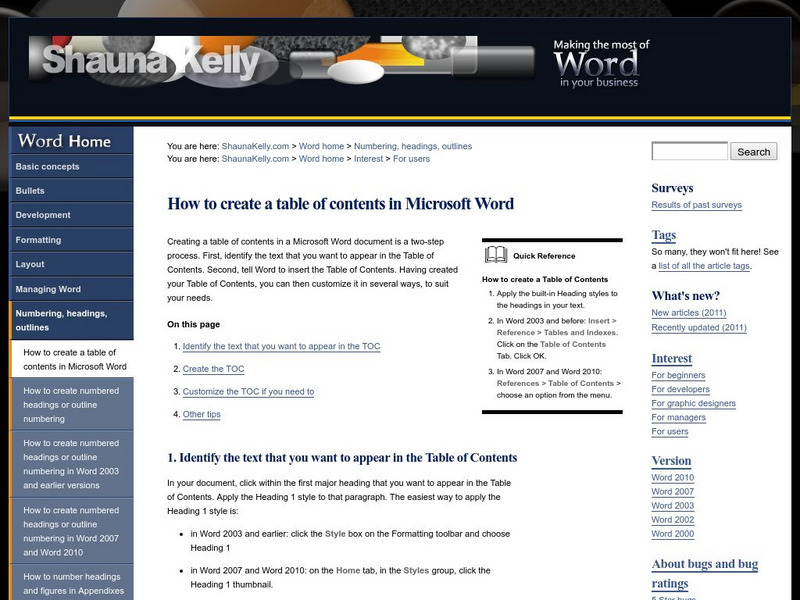
Shauna Kelly: How to Create a Table of Contents in Word
This article explores how to create a table of contents in Microsoft Word using the styles tool. Written with step-by-step instructions, the article includes information on how to create the table of contents, how to customize it, and...


