Curated OER
Pie Charts
The teacher conducts a survey of each student's favorite color. The teacher then creates a pie chart identifying the information gathered. The students display mastery by creating their own pie chart displaying the same information.
Curated OER
Eye Color
Learners take a survey on eye color and plot their findings into a graph. In this eye color lesson plan, students take a class survey of everyone's eye color and learn how to put those findings into a graph.
Curated OER
Save the Earth: It's Everyone's Home!
Students create artwork to remind them to conserve the Earth. In this conservation lesson plan, students discuss the Earth's conservation and then create an art project representing what they can do to conserve.
Curated OER
A Measure of Happiness
Students share opinions about the factors that contribute to or detract from their happiness. They create survey to determine how people in their community measure happiness, and write reflections on the relationship between money and...
Curated OER
Tasty Tech Activity With Excel
Students are introduce to basic Excel skills, rank their opinions of menu items from fast food restaurants, add their answers to the spreadsheet, and then create a simple graph of the results.
Curated OER
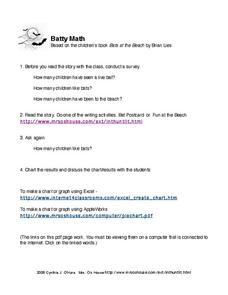
Batty Math
In this bats worksheet, students click on the link to read a story about bats and then answer short answer questions, take a survey, and create graphs about it. Students complete 4 tasks total.
Curated OER
Class Ketchup
Students describe statistics by conducting a class cooking activity. In this ketchup lesson, students conduct a class survey based on ketchup consumption habits by students. Students utilize tomatoes, water and a bottle to create their...
Curated OER
The Effects of Counseling on The Potential Drop-out
Tenth graders analyze information from students who have left school before graduation, and utilize the information as a strategy designated to lower the drop-out rate of the at-risk students. They design a rubric, create a web page, and...
Curated OER
Computer Graphing
Students research the Internet or create surveys to find graphable data. They collect, organize, analyze and interpret the data. Finally, they choose the appropriate type of graph to display the data and find the measures of central...
Curated OER
A World of Favorites
Investigate students' favorites worldwide by having them create and publish a questionnaire to gather information about students' favorites. They will conduct research about a continent, create three web pages and a chart representing...
Curated OER
The Circle Graph
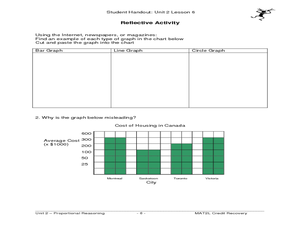
In this circle graph worksheet, students complete problems involving many circle graphs including a compass rose, degrees, and more. Students complete 7 activities.
Curated OER
Top Reasons to Attend My School
Young scholars evaluate reasons why someone would attend their school and create a marketing campaign to attract students. In this school welcome lesson, young scholars analyze the marketing process and survey public sectors about their...
Curated OER
Applied Science-Science and Math (2A) Post Lab
Second graders create a graph about TV watching. In this bar graph lesson, 2nd graders make a hypothesis about how much TV 2nd graders watch per week. They record their TV watching for a week and bring it to school to create a class...
Curated OER
Bilbo Baggins, at your service!
Learners choose a character from The Hobbit to create an imaginative product such as poetry, music, sculpture, painting, or web page) that reflects the character. They must indicate a connection to the character (example: I am similar to...
Curated OER
Winter Song Photo Story
In this winter songs worksheet, students create a winter song photo report about their favorite winter song. Students include 4 items in the report.
Curated OER
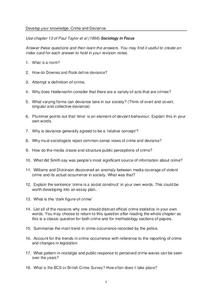
Crime and Deviance
For this Crime and Deviance worksheet, students answer seventy-eight questions, then respond to ten essay questions on these topics.
Curated OER
How Many Days Did It Take for Your Bean Seed To Germinate?--class Bar Graph
In this math/science worksheet, students collaborate as a class to create a bar graph which displays the germination time for bean seeds. Students survey their classmates and plot results on a graph.
Curated OER
Creating Graphs
This graphing PowerPoint demonstrates how to use graphs to gather information. The slides contain examples of graphs and display the data clearly. This presentation also gives clear directions on how to construct various graphs by using...
Curated OER
Young Voters Make A Difference
Students research recent statistics on voting by those 18 to 24. They survey senior students to determine their intent to vote in the next election. Students display the data in charts and graphs. They write the results and share it with...
Curated OER
Driving Safety and Distractions
Students perform research about the problem of distractions caused by technology. The importance of the problem is formulated after the research is done. Students write an article based upon answering the problem.
Curated OER
Basics of Environmental Science
Ninth graders explore environmental concerns of the community and identify the basic needs of people, wildlife and domestic animals. Working both individually and in groups, they also define natural resources and compare and contrast...
Curated OER
Survey Savvy
Third graders design appropriate questions for a survey, survey classmates, create a pictograph to represent the results, and explain the survey results.
Curated OER
Math:Survey Role-Playing Activity
Students create survey questions to discover why students join clubs. Using sampling methods and question phrasing techniques, they conduct the survey both in and out of school. Once students analyze their survey information, they...
Curated OER
Recycling Attitudes Survey
Learners create and administer surveys to provide information about attitudes toward recycling. Each student administers a class-created survey to at least four different individuals. As a class, students analyze their findings and...


