Curated OER
Qualitative and Quantitative Data
Seventh graders study the different ways that they have been evaluated over the years. In this qualitative and quantitative lesson students complete a learning activity while in groups.
Curated OER
Probability or Ability?
Students use their non-dominant hand to catch candy which they tossed in the air. They estimate how many they catch in a second round. They record and determine how the probability changed the second time.
Curated OER
Lesson: Journey of a Tree
Third graders explore the operation of a Christmas farm and how trees are shipped. After taking a tour of a Christmas tree farm and researching transportation, location and cost issues, 3rd graders create a map to show the distribution...
Curated OER
Fish Workings
Students observe, hypothesize, and draw conclusions regarding fish. They examine their anatomy, and how they function in their environment.
Curated OER
Elder Migration: Grandparents and Where They Live Lesson Plan
Students examine how migration affects population change. In groups, they create a list of reasons why adults change residences and research migratory patterns among older adults. They explain the effects of migration of senior members...
Curated OER
Dishing the Dirt Part 1
Young scholars create a soil center on their school grounds. They begin to write in their science journals. They participate in an experiment that helps the community begin their own gardens.
Curated OER
Rainy Day Hike
Students develop awareness about the water cycles. They identify the watershed in which their school is located. They explain the role the schoolyard plays in the watershed.
Curated OER
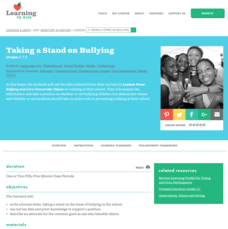
Taking a Stand on Bullying
Middle schoolers stand up against bullying in a character-building lesson. After discussing historical figures who became advocates in times of adversity, they brainstorm ways to end bullying at their own school, and use a formal letter...
Curated OER
Unit 2: Lesson 7
Students are introduced to spreadsheets. They conduct a survey of television viewing time of different shows based on different age categories. Students work in small groups. They collect, data and interpret the data from a survey.
Curated OER
Our Favorite Season Lesson Plan
Fifth graders complete a survey about their favorite season of the year. Using Excel, they create a graph using the chart wizard and copy it into Microsoft Word. They explore the relationship between the survey and the bar graph.
Curated OER
Balloon Graphing
Fourth graders explore data, charts and graphs. They create graphs using titles, labels, axes, intervals, and scale correctly. Students enter their data into Excel and create a graph.
Curated OER
Exploring Air Issues
Students collects survey data from their community on air pollution. In this environmental science lesson, students consider the opinion of the community on air pollution and create a plan to reduce it. Students plan on creating a...
Curated OER
Taking the human rights temperature of your school
Students, after surveying the human rights environment at the school, develop a personal action plan to improve the human rights situation within the school.
Curated OER
Closing the Case
Fifth graders collect data and prepare data displays using a survey with statistical information.
Curated OER
Design a Community Flag
Students research basic principles for flag design. They investigate where their city flag ranked in a national survey. Students use computers and apply the principles of flag design to create their own community flags.
Curated OER
Lands That I Love
Students create a graph showing their family roots. They read about how immigrants can develop strong feelings for two countries. They discover the importance of their earliest memories.
Curated OER
Thinking about Energy
Students navigate through a web-based survey to help engage curiosity about energy concepts. They describe how prior perceptions influence examineing of energy concepts. They evaluate comprehension about concepts of energy.
Curated OER
Statistical Accuracy and Reliability
Ninth graders assess the accuracy and reliability of current survey data and how it is represented. They design a survey, collect data, and use technology to analyze the data and present the results. Students examine scatter plots and...
Curated OER
What Can Scatterplots Tell Us?
Eighth graders use data from surveys conducted with parents, peers and themselves to create computer-generated scatterplots. They make inferences from their scatterplots.
Curated OER
Running a School Bakery
Students explore marketing concepts while producing food items to sell.
Curated OER
Ketchup to Collecting Data
First graders collect data for a survey of 3 brands of ketchup and create class charts. They taste test three different brands of ketchup, and use the data to create a presentation. Tasty lesson!
Curated OER
Report of Shop, Factory, Mill or Industrial Establishment
Students examine the pollution survey created in response to the Public Health Laws of 1903, and compare/contrast polluting factory discharges in 1903 to those allowed today. They analyze the report survey, complete a worksheet, and...
Curated OER
Graphing Data
Second graders examine how to make and read bar graphs. For this bar graph lesson, 2nd graders compare bar graphs to pictographs by looking at hair color survey data. They practice making a bar graph and finding the range of the data.
Curated OER
Frenzied Food: Fantastic Fuel?
Students infer the causes of obesity. In this health science lesson, students brainstorm ways improve to their diet. They write personalized journals with goals on how to live a healthy lifestyle.


