101 Questions
Woody's Raise
You want to be where everyone gets a raise. A short clip from the TV show Cheers provides the context for the task. After watching an interaction between a bartender and an owner regarding a raise, viewers write inequalities to represent...
Curated OER
TV Survey - Data Collection and Analysis
In this data collection and analysis worksheet, 4th graders complete a tally chart about the number of hours that fourth graders watch television. They create a bar graph with the information, write a paragraph about the survey results,...
CCSS Math Activities
Smarter Balanced Sample Items: 7th Grade Math – Claim 2
To solve or not to solve that is the problem. A slide presentation of 17 items show different ways that Smarter Balanced assesses Claim 2, problem solving. The items span from sixth and seventh grade concepts to highlight the...
EngageNY
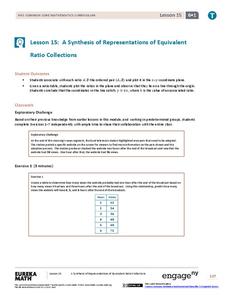
A Synthesis of Representations of Equivalent Ratio Collections
Make all the ratio representations fit together. The 15th segment in a series of 29 presents ratio problems to solve. Scholars use a variety of representations to respond to the questions. The problem set has pupils show how the...
Curated OER
Television: Comedy Vs. Drama
Students investigate the world of Television by contrasting specific programs. In this visual storytelling lesson, students compare and contrast the differences between comedy and drama by making a Venn Diagram. Students...
Curated OER
The Price Is Right - TV Game Show
Learners play variation of TV game show "The Price is Right" to identify coins and their values.
Curated OER
Estimation and Your TV Diet
Students develop estimation skills by using real life situations. In this estimation lesson students collect data about their television watching habits. They make hypothesis about the number of hours they watch, how many...
CK-12 Foundation
Fitting Lines to Data
Scatter the TV sales over weeks. Pupils create a scatter plot to display the number of TV sales over a period of several weeks. The interactive allows class members to create two lines of best fit. Then they determine which line fits...
Kenan Fellows
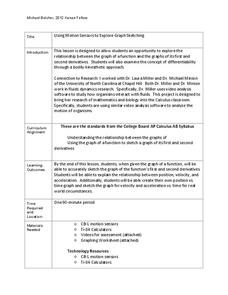
Using Motion Sensors to Explore Graph Sketching
Get moving to a better understanding of graphs of derivatives. Using motion sensors, scholars vary their velocities to create graphs of the first derivative of a function. The activity challenges groups to first create a script of the...
Curated OER
Scatter-Brained
Seventh graders graph ordered pairs on a coordinate plane. They create a scatterplot. Additionally, they determine the line of best fit and investigate the slope of the line. Multiple resources are provided. An excellent resource!
Creative Educator
Fantastic Fractions
Groups of learners create an animation illustrating fractions using common objects. They choose everyday objects that they can divide into fractions. They take pictures of the objects dividing into fractions and create an animation with...
Curated OER
Selling Solutions
Students identify, design and present specific information to sell their idea for reducing the impacts of climate change. Students create a television or print advertisement. Students utilize technology to create a final project....
Curated OER
Econ in a Bag
Here is a nice idea, have your young entrepeneurs form their own companies. Each company is given a paper bad to locate and place resources in that they can use to create products their businesses sell on Sale Day. They identify and...
Laura Candler
Time Capsule
It's amazing how much kids change from the beginning of the year to the end. Create a written account of their growth with a fun worksheet that involves children recording information about themselves at two points...
Curated OER
Mathematicians Research Projects
Students research a famous mathematician and create a presentation of their research. In this famous mathematician research instructional activity, students decide on a famous mathematician that they would like to learn more about. They...
CK-12 Foundation
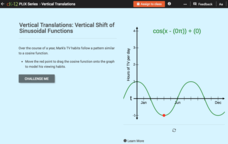
Vertical Translations: Vertical Shift of Sinusoidal Functions
Create a shift in TV viewing habits. The interactive presents a cosine model of an individual's TV viewing habits during a year. Class members move the model to reflect given conditions. Finally, they determine key features from the...
Tech4Learning
Fantastic Fractions
Learners study how shapes can be divided into equal parts, that each part be equal to its counterpart, and combining parts equals one whole. They make the shapes out of modeling clay and take digital pictures of its parts to create an...
Curated OER
M&M Graphing
Fourth graders name colors of M&Ms and record answers. They estimate number of M&Ms of each color found in a typical package of M&Ms on piece of paper.They record information on sheet of paper and create a spreadsheet. paper.
Curated OER
Math Sleuths
Help learners practice their math skills by utilizing the Internet to research a mathematical topic. Your math sleuths will investigate a science or social studies topic from their curriculum and construct a Math Hunt Grid. They create a...
Shodor Education Foundation
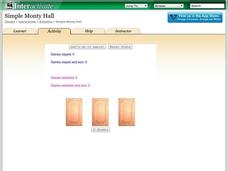
Simple Monty Hall
What's behind door number one? A fun resource lets learners simulate the classic Monty Hall probability problem. Pupils choose a door, and after they select a losing door, they decide whether to switch or stay. Using their decisions, the...
Curated OER
Creating Bar Graphs and Pie Graphs
Second graders observe a demonstration of the creation of a bar graph and a pie graph of their favorite colors. They gather information about various topics from their classmates, then organize the information, creating a bar and a pie...
Curated OER
Box and Whiskers
Middle schoolers discover how to relate collected data with a box and whiskers graph in a number of formats. They collect, organize, create, and interpret a box and whiskers graph. Pupils interpret the difference between sets of data,...
Curated OER
Arrays of Food
This lesson is based on video clip 220 from the Count on it! series, however the same problem can be posed with out the video. Learners work independently to determine the amount of dried food they will need for a camping trip. Each...
Curated OER
Junior Architects of America
Students create entries for the Architects of America contest, including a model of a futuristic structure, blueprints, a list of all plane and solid shapes in the structure, a persuasive argument paper that describes why the structure...


