Mathematics Assessment Project
Functions
Studying function means more than simply learning a formula. Learners must use functions to think through four problems and find solutions. Each task utilizes a different concept from a study of functions. Class members might...
Shodor Education Foundation
Data Flyer
Fit functions to data by using an interactive app. Individuals plot a scatter plot and then fit lines of best fit and regression curves to the data. The use of an app gives learners the opportunity to try out different functions to see...
Creative Learning Exchange
Lesson Plans From The Lorax
When it comes to the environment, no variable is constant. Class members graph behavior over time for the thneeds produced over truffula trees chopped down over the course of Dr. Seuss's The Lorax.
Virginia Department of Education
Types of Variations
Scholars determine how two quantities vary with respect to each other. They complete a fill-in-the-blank activity by stating whether the entities vary directly, inversely, or jointly, create equations that match different variations, and...
Virginia Department of Education
Independent and Dependent Variables
Investigate the relationship between independent and dependent variables. Individuals begin by identifying independent and dependent variables from different problem situations. Then, using specific guidelines, they create posters...
Curated OER
GSE Foundations of Algebra: Equations and Inequalities
Need lessons on writing and solving one- and two-step linear equations and inequalities, as well as systems of equations? This comprehensive 106-page module from the Georgia Department of Education contains many different lessons for a...
Chicago Teachers Union Quest Center
Factored Form of a Quadratic Function
Build upon linear functions to learn about quadratics. The lesson introduces the concept of zeros for quadratic functions and makes the connection to the linear factors of the function. It presents quadratics in both graphical and...
CK-12 Foundation
Ellipses: The Ellipse
Learners explore ellipses by changing the lengths and orientation of the major and minor axis. Using the interactive, they determine the equation of the ellipse and its eccentricity. Given an equation the scholars identify the center,...
CK-12 Foundation
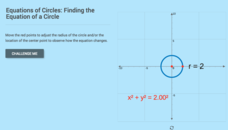
Equations of Circles: Finding the Equation of a Circle
It's all about location and size. With the aid of the interactive, pupils explore the relationship between the location and size of a circle and its equation. The learners use that relationship to determine the equation of a circle given...
Howard Hughes Medical Institute
Patterns in the Distribution of Lactase Persistence
We all drink milk as babies, so why can't we all drink it as adults? Examine the trend in lactase production on the world-wide scale as science scholars analyze and interpret data. Groups create pie charts from the data, place them on a...
CK-12 Foundation
Using Quadratic Equations to Solve Problems: Construct a Soccer Field
Build a soccer field through a little mathematical analysis. Individuals manipulate the dimensions of a soccer field as they drag points to new positions. The simulation shows the corresponding intercepts and area. As pupils explore the...
CK-12 Foundation
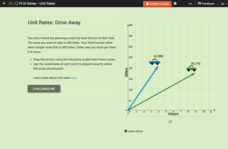
Comparison of Unit Rates: Drive Away
Five questions make up an interactive that challenges mathematicians to compare unit rates. Word problems question scholars about two friends going on a road trip. Scholars manipulate two cars on a coordinate plane to help solve word...
Curated OER
Bar and Histograms (What Would You Use: Part 1)
Students practice creating bar graphs using a given set of data. Using the same data, they create a group frequency chart and histograms. They must decide the best graph for the given set of data. They share their graphs with the...
Curated OER
Understanding Statistics
In this statistics worksheet, students examine and interpret pictographs and line graphs. Students analyze the provided data in order to create bar graphs, circle graphs, and box and whisker plots. The nine page worksheet accompanies a...
Curated OER
Pie Graph
Fifth graders examine fractional parts of pie graphs. Given a bag of M&Ms, 5th graders interpret the data. They use a paper plate and colors to create a graph of the types of M&Ms represented.
Curated OER
Favorite And Least Favorite Vegetable Survey and Bar Graph
In this favorite and least favorite vegetable survey, students create a bar graph after they survey and keep track of data on this graphic organizer.
Curated OER
Count on Math
Students develop number sense up to a million. In this developing number sense up to a million lesson, students count their breaths in given time span. Students use blocks representing 10's and 100's to create a...
Curated OER
Name Count and Graph
Students find the frequency of a name in selected states by using the Internet. They input data into a spread sheet. They create a graph that illustrates the gathered information.
Curated OER
Chart Your Course
Students explore change represented in graphs comparing distance and time. They exchange and share their graphs. Students interpret and create distance versus time line-graphs, and write stories based on these graphs. They interpret a...
Curated OER
Domain and Range 2
How do you identify the domain and range of the function? As learners find out it's as easy as creating a graph. They'll identify the domain and range of a relation from its graph, write symbolic expressions describing the relationship...
Curated OER
Charting Historical Gas Prices
Students investigate the historical and current prices of a gallon of gasoline. Using an online tool, they calculate the inflation-adjusted cost of gasoline over the years, and create a graph to demonstrate the actual cost vs. the...
Curated OER
What Did It Cost 100 Years Ago?
Students compare prices of good across the century in order to introduce the topic of inflation. They undertand the concepts of inflation and Consumer Price Index (CPI), use online calculators to figure the approximate cost of goods...
Curated OER
The Webb Space Telescope: Detecting Dwarf Planets
For this detecting dwarf planets worksheet, students read about the Webb Space Telescope that will be launched in 2014 to detect dwarf planets using an infrared telescope. Students solve 3 problems and create a graph for each using given...
Curated OER
Rainforest Unit
Learners investigate the Rainforest. In this Rainforest instructional activity, students research magazines, journals and the Internet to create a "Save the Rainforest" slogan. Learners will record local rainfall amounts and create a...


