CK-12 Foundation
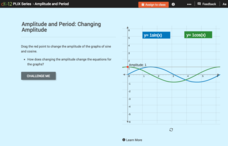
Sine Graph and Cosine Graph: Changing Amplitude
Scholars manipulate the amplitude of the graphs of sine and cosine, notice how the change in amplitude is reflected in their graphs, and answer several questions about the concept they noticed.
CK-12 Foundation
Interpretation of Circle Graphs: Northwest Region Population Pie
Given populations of the five Northwestern states, learners create a circle graph. Using the data and the pie chart, they make comparisons between the populations of the states. Finally, the pupils determine how the chart will change...
CK-12 Foundation
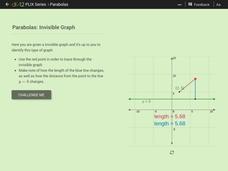
Parabolas: Invisible Graph
Envision the function as the point swings. Given a point connected to another point and a line, pupils trace through an invisible graph. Learners identify the name of the given point and the line and determine the type of conic section...
CK-12 Foundation
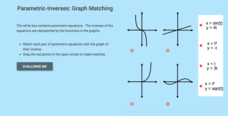
Parametric-Inverses: Graph Matching
Perform a switch to find the inverse of a parametric equation. Pupils match four parametric functions with the graph of the their inverses. Using the graphs, learners determine whether particular points are on the original parametric...
CK-12 Foundation
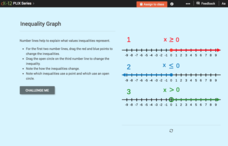
Inequality Expressions: Inequality Graph
Don't let inequalities be a drag. As young mathematicians drag the endpoint of the graph of an inequality in an interactive, the algebraic form of the inequality changes. This helps them see how the graph connects to the inequality.
CK-12 Foundation
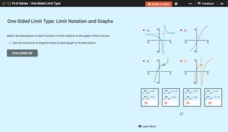
One-Sided Limit Type: Limit Notation and Graphs
A one-sided limit is no less important than a two-sided limit. Young mathematicians use an interactive to match limit notation to graphs. The exercise requires interpreting how one-sided limits connect to features of graphs.
CK-12 Foundation
Graphs Using Slope-Intercept Form: Zip-Line
Zip lines aren't so scary when all your scholars use them for is math. Young mathematicians see how the slope of a zip-line to a building changes as the height changes. They answer a set of challenge questions regarding the scenario.
CK-12 Foundation
Graphs in the Coordinate Plane: Functions on a Cartesian Plane
Connect the dots to graph a linear function. Young mathematicians use an interactive to first plot provided points on a coordinate plane. They connect these points with a line and then answer questions about the slope and y-intercept of...
CK-12 Foundation
Function Rules based on Graphs: Making Money in the Hat Business
Hats off to those learning about the graphs of functions. Individuals use an interactive to plot points representing profits for a hat business. They identify a quadratic equation to represent this function and answer challenge questions...
CCSS Math Activities
Smarter Balanced Sample Items: High School Math – Claim 3
Communication is the key. A presentation provides 25 sample items for Claim 3, Communicating Reasoning, for the Smarter Balanced High School Math assessment. Items require pupils to answer the question and provide logical reasoning to...
Curated OER
Creating a Thematic Map
Students create and analyze a weather-related data table and a thematic map based upon information provided.
Heidi Songs
Zoo Animal Probability Graph
Capture the engagement of your young mathematicians with a collaborative graphing activity. Using a deck of zoo animal picture cards, students select a picture from the deck, record the chosen animal on a graph,...
EngageNY
Graphing Cubic, Square Root, and Cube Root Functions
Is there a relationship between powers and roots? Here is a lesson plan that asks individuals to examine the graphical relationship. Pupils create a table of values and then graph a square root and quadratic equation. They repeat the...
Curated OER
Use Google Maps to Teach Math
Capture the engagement of young mathematicians with this upper-elementary math lesson on measuring time and distance. Using Google Maps, students first measure and compare the distance and time it takes to travel between different...
Math Worksheets Land
Pie or Circle Graphs—Step-by-Step Lesson
How do you display data that you've collected in a pie chart? Follow a clear step-by-step guide to turning survey results into a visible format. It shows kids how to determine the percentage of the whole that each section represents.
Benjamin Franklin High School
Saxon Math: Algebra 2 (Section 9)
Section 9 of the 12 linked Saxon Math sections introduces the young algebrist to graphing periodic functions, creating graphs from quadratic roots, working with inequalities, and rational equations. Common among all the lessons is the...
Curated OER
Math Games for Skills and Concepts
A 27-page packet full of math games and activities builds on algebra, measurement, geometry, fractional, and graphing skills. Young mathematicians participate in math games collaboratively, promoting teamwork and skills practice.
CK-12 Foundation
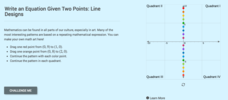
Graphs of Linear Functions: Line Designs
Designs from lines are sublime. Scholars create colorful designs by connecting points on an interactive coordinate plane. They answer questions about slope and quadrants based on their designs.
Radford University
Can I Create a Line/Curve of Best Fit to Model Water Drainage?
Learners collect data on the amount of water left in a bottle over time. They graph the data to determine whether the scatter plot shows a curved or straight relationship. Group members then determine an equation for the curve of best...
Curated OER
Math: Graphs and Their Symbols
Second graders examine different types of graphs and discover the meanings of the symbols used on them. After gathering data about themselves, their communities, and the world, they use that information to create graphs. Among the...
Teachers Network
A World of Symmetry: Math-Geometry
Define and identify the three basic forms of symmetry translation, rotation, and glides with your class. They cut out and arrange paper pattern blocks to illustrate symmetry, create a Cartesian graph, and design a rug with a symmetrical...
Mixing In Math
Mixing in Math: Growing Plants
Whether you have your class plant seeds or begin when sprouts are visible, math skills are used here to predict and track growth over time. Straw bar graphs show plant height on a given day while the graph as a whole shows changes over...
Curated OER
M&M’s Math Worksheet
Who knew you could cover prediction, histograms, fractions, decimals, data collection, and averages (mean, median, and mode) all with a bag of M&M's®? Here's a fantastic set of worksheets to help you make candy a mathematical journey...
Mt. San Antonio Collage
Test 1: Functions and Their Graphs
Save the time creating an assessment because these function problems should do the trick. With 10 multi-part questions, they each focus on a different topic including radical, polynomial, linear and piecewise functions. The majority of...
