US Department of Commerce
Commuting to Work: Box Plots, Central Tendency, Outliers
Biking may be an outlier. Using data from 10 states on the number of people reporting they bike to work, pupils calculate the measures of center. Scholars determine the range and interquartile range and find which provides a better...
Curated OER
James and the Giant Peach Plot Analysis
It's all about the plot, main events, and story mapping with this lesson. As the class reads the novel James and the Giant Peach, they create an excitement graph that actually charts key events and moments of excitement. After...
Texas Education Agency (TEA)
Archetypes, Motifs, and Plot in Drama (English II Reading)
The second interactive in a series of 10 introduces young scholars to character archetypes, archetypal plot patterns, and archetypal motifs, including the use of color. Learners read passages explaining the term and study examples from...
Curated OER
Animal Brains
Do big bodies make big brains? Let your learners decide whether there is an association between body weight and brain weight by putting the data from different animals into a scatterplot. They can remove any outliers and then make a line...
Science Matters
Plot Study
Small groups investigate plots of land to discover how abiotic and biotic factors interact. After recording their findings, scholars share observations with peers and self-reflect on the learning process.
Curated OER
Express Yourself Lesson Seed 12: Story Event
Focus on plot and the impact-specific events in The Cay. Class members use their double-entry journals, created in a previous lesson in this series, to record their thinking about the guiding question as they read chapters 15 through 17....
Illustrative Mathematics
Puzzle Times
Give your mathematicians this set of data and have them create a dot plot, then find mean and median. They are asked to question the values of the mean and median and decide why they are not equal. Have learners write their answers or...
Scholastic
A Reading Guide to Sarah, Plain and Tall
Eliminate the hard work of creating an entire literature unit with this reading guide for the novel Sarah, Plain and Tall. From background information about the author and her motivation for writing the story to...
Curated OER
Hand Span and Height
Is there a relationship between hand span width and height? Statisticians survey each other by taking measurements of both. A table that can hold data for 24 individuals is printed onto the worksheet, along with questions for analysis....
Saxon
Plotting Functions
Youngsters use a graphing calculator to assist in creating a function table. They graph the function on a coordinate plane. They explore the relationship between the domain and range in the graph. This four-page worksheet contains two...
Illustrative Mathematics
Electoral College
A cross-curricular resource that takes the electoral votes and allows your learners to organize and analyze the data. Young voters can determine which states are more influential and interpret the dotplot provided for more data....
Curated OER
Button Bonanza
Collections of data represented in stem and leaf plots are organized by young statisticians as they embark some math engaging activities.
Illustrative Mathematics
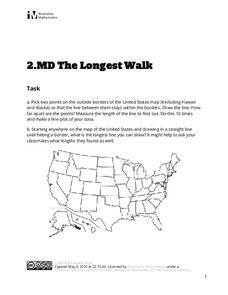
The Longest Walk
How long of a line can you draw within this activity? Learners pick two points outside and within the map to create the longest line they can. After drawing 10 lines, learners plot the length of each line on a line plot. Then they...
Curated OER
Tech Integration Project Lesson Accelerator: Project Overview
Talk about technology in the classroom. This plan has all the resources needed to create a non-linear or branching story. Included is a step-by-step tutorial that walks middle schoolers through the project description, a model of a...
US Department of Commerce
Does the Percentage of People Who Walk to Work in Cities Vary with Population Size?
To walk or not to walk? Pupils create box plots comparing the percentage of residents who walk to work in large, medium, and small cities. Using the box plots, class members compare the data that reflects available statistics. Scholars...
PBL Pathways
Do Homework?
To complete homework or not to complete homework ... that is the question. Decide whether it makes a difference on finals by doing homework. Individuals create a scatter plot and find a line of best fit for data on the percent of...
Newspaper Association of America
Celebrating Women’s History Month
Examine the lives of four women—Blanche Stuart Scott, Madeleine L'Engle, Margaret Evans Price, and Sybil Ludington—in a 23-page activity packet. Each profile comes with a set of vocabulary and reading comprehension questions. Further...
Las Cumbres Observatory
Plotting an Asteroid Light Curve
Data can tell us a lot about celestial objects that are just too far away to study otherwise. Learners examine data on the brightness of an asteroid to predict its rotation rate. Graphing the data reveals a periodic pattern that allows...
Las Cumbres Observatory
Plotting a Supernova Light curve
Supernovas burn for a short time but can give scientists extensive information about the universe. Learners analyze given data about the change in the light magnitude of a supernova. They look for patterns in the data and use them to...
PBL Pathways
Doctors and Nurses
How many nurses does it take to support one doctor? A project-based activity asks learners to analyze state data to answer this question. Classes create polynomial functions from the data of doctors and nurses over a seven-year...
PBL Pathways
Students and Teachers
Predict the future of education through a mathematical analysis. Using a project-based learning strategy, classes examine the pattern of student-to-teacher ratios over a period of years. Provided with the relevant data, learners create a...
National Council of Teachers of Mathematics
Eruptions: Old Faithful Geyser
How long do we have to wait? Given several days of times between eruptions of Old Faithful, learners create a graphical representation for two days. Groups combine their data to determine an appropriate wait time between eruptions.
Prestwick House
Wuthering Heights
How many ways can you break down a classic novel? Based on the acclaimed Romantic-period novel by Emily Bronte, the Wuthering Heights activity pack includes a pre-reading exercise. Next, learners create a resume for one of the...
Ziptales
The Pied Piper of Hamelin
Scholars create a brochure that features three aspects of the poem "The Pied Piper of Hamelin." The program details information about Robert Browning, the poem's setting, and its events.


