Curated OER
Solar Kit Lesson # 12 - Calibration Curve for a Radiation Meter
Scientists need to have mastered algebraic slope-intercept concepts in order for this lesson to be effective. They will measure and graph solar panel output as a function of the amount of radiation striking it, discovering that there is...
CK-12 Foundation
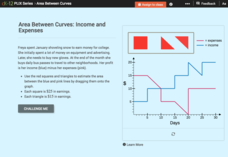
Area Between Curves: Income and Expenses
Use the area of polygons to calculate the area between curves. Pupils calculate areas under income and expense curves by filling the space with squares and right triangles. Using that information, they determine the profit related to the...
Curated OER
Curved Lines
In this curved lines worksheet, students examine equations that, when graphed, present a curved line. They explore specified points on the graphed line and write an equation for the tangent line at given points. This two-page worksheet...
Virginia Department of Education
Curve of Best Fit
Which function models the data best? Pupils work through several activities to model data with a variety of functions. Individuals begin by reviewing the shapes of the functions and finding functions that will fit plotted data points. By...
CK-12 Foundation
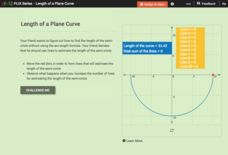
Length of a Plane Curve
Challenge your class to use straight lines when estimating the length of a curve. An engaging interactive allows individuals to place line segments one after another along the arc. Learners determine that the more lines used, the better...
Curated OER
Scatter Diagrams and Curve Fitting
In this Scatter Diagrams and Curve Fitting worksheet, students are guided in how to graph a scatter diagram (plot) and a Best Fit Line using a TI-83 graphing calculator.
Curated OER
Exploring and Using Shapes to Make a Dance
Second graders use their bodies to create various shapes to make a dance when given various music and beats. In this shapes and dance lesson plan, 2nd graders create lines, curves, twists, and angles with their bodies.
EngageNY
Using a Curve to Model a Data Distribution
Show scholars the importance of recognizing a normal curve within a set of data. Learners analyze normal curves and calculate mean and standard deviation.
Balanced Assessment
On Averages and Curves
Determine the average on a curve. The class finds graphical representations of averages and expresses them both symbolically and on the graph. The assessment requires class members to justify using average to describe graphs.
Curated OER
Finding the Area Under A Curve with Random Probability
Students explore the concept of area under a curve. In this area under a curve lesson plan, students find the area under a curve using the Monte Carlo method using random points and probability. Students calculate the area under the same...
Curated OER
Areas Under Curves: An Astronomical Perspective
In this area under the curve activity, students use a graph of the number of exoplanets discovered and the year they were discovered to solve 5 problems. Students find the total area under the curve, they find the total number of planets...
Alabama Learning Exchange
I'm Lovin' It: Finding Area Between Curves
Students explore the concept of finding the area between two curves. In this finding the area between two curves instructional activity, students model the logos of McDonalds, Nike, and Motorola on grid paper. Students find functions to...
Curated OER
Modeling the Keeling Curve with Excel
In this modeling the Keeling Curve worksheet, learners use given data beginning in 1960 to create a mathematical model for the changes in atmospheric carbon dioxide over time. Students manipulate the equation to predict the carbon...
Curated OER
Curve Sketching
In this calculus worksheet, students sketch a curve using a given function. They take the derivative of a function and graph it. There are 10 questions.
Curated OER
Area of Curve
In this calculus activity, students calculate the area of a curve bounded between two regions. There are 2 questions asking for the area and length of a curve.
Curated OER
The Region Between Two Curves
Learners find the area of a region between two curves. They integrate functions such as sin(x) and cos(x) on a given interval and find the area bounded by the two functions. Pupils use their TI-89 to aid them in finding the bounded...
Shodor Education Foundation
Overlapping Gaussians
Adjust the overlap to compare probabilities. Using sliders, learners adjust the shape of two Gaussian curves. The interactive calculates the area of the left tail for one curve and the right tail for the other. Pupils set the interactive...
Radford University
Pollution and Curves of Best Fit
Don't put the resource on curves of best fit out on the curb. Using researched data on trash and recycling, scholars create scatter plots and regression curves to analyze the information. As a culminating activity, they complete projects...
Radford University
Can I Create a Line/Curve of Best Fit to Model Water Drainage?
Learners collect data on the amount of water left in a bottle over time. They graph the data to determine whether the scatter plot shows a curved or straight relationship. Group members then determine an equation for the curve of best...
Radford University
Curve of Best Fit
Don't watch the resource go down the drain. Scholars perform an experiment where they measure the amount of water that flows from a funnel over time. They use the data to create graphs and find the curves of best fit.
Curated OER
Length of a Curve
In this curved lines worksheet, students measure the length and answer questions about curved lines. Students complete 6 short answer questions.
Curated OER
Area Under A Curve
Calculus young scholars use the derivative and integral to solve problems involving areas. They calculate the area under a curve as they follow a robot off road making different curves along the drive, using Riemann Sums and Trapezoidal...
Shodor Education Foundation
InteGreat
Hands-on investigation of Riemann sums becomes possible without intensive arithmetic gymnastics with this interactive lesson plan. Learners manipulate online graphing tools to develop and test theories about right, left, and midpoint...
CK-12 Foundation
Area Sums: Estimation with Rectangles
The more rectangles, the better the estimate. Using the interactive, pupils explore estimating the area under a curve using left-hand sums. Learners respond to challenge questions on how to get better estimates using the same technique.
Other popular searches
- Demand Curve
- Bell Curve
- Area Under the Curve
- Solubility Curve
- Closed Curves
- Heating Curve
- Gradient Curves
- Area Under a Curve
- Curved Lines
- Production Possibilities Curve
- Open Curves
- Curved Mirror


