Curated OER
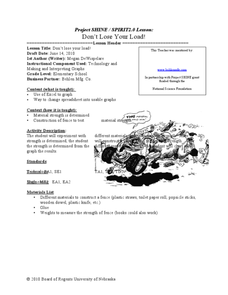
Don't Lose Your Load!
Students create graphs using collected data. In this algebra instructional activity, students use spreadsheet in Excel to create graphs to interpret their data and make predictions. They rewrite word problems using algebraic expressions.
Curated OER
The Swinging Pendulum
Students observe a pendulum and graph their observation. In this algebra lesson, students use the TI calcualtor to graph the motion the pendulum makes. They analyze the graph and make predictions.
Curated OER
Picasso's "The Dog"
Students draw a dog. For this drawing lesson, students discover how to tap into their right brain dominance by sketching a picture upside down. Students draw a picture resembling Picasso's "The Dog".
Curated OER
Matisse's "La Pompadour"
Middle schoolers sketch a picture. In this drawing lesson, students sketch Matisse's "La Pompadour". In an attempt to tap into their artistic side, middle schoolers turn the picture upside down to sketch.
Alabama Learning Exchange
The Composition of Seawater
Students explore the concept of finding the composition of seawater. For this finding the composition of seawater instructional activity, students make a saturated salt water solution. Students discuss why there is variation in ocean...
Curated OER
Lesson Plan On Fran Data
Seventh graders investigate the concept of functions and how they are used in the context of the real world while identifying the dependent and independent variables. They graph relations and functions and find the zeros of functions....
Curated OER
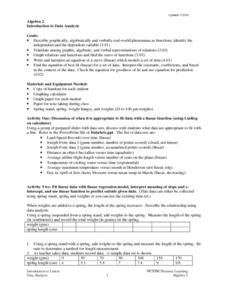
Introduction To Data Analysis
Seventh graders investigate the concept of looking at the data put in a variety of ways that could include graphs or data sets. They analyze data critically in order to formulate some sound conclusions based on real data. Students graph...
Curated OER
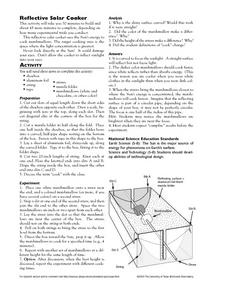
Reflective Solar Cooker
Students build and use a reflective solar cooker to cook marshmallows.
Curated OER
Assessment & Evaluation
Seventh graders study elapsed time, radioactive decay and half-life. In this time machine lesson students complete several activities and view a presentation.
Curated OER
Properties of Logarithms
Eleventh graders investigate logarithms. In this Algebra II lesson, 11th graders explore the properties of logarithms that are used to simplify expression and solve equations. Students confirm their conjectures regarding the properties...
Curated OER
Sort Solid Figures
For this solid figures worksheet, students read the word problems about the solid figures and find the figure that follows the rule.
Curated OER
Viewing Tubes
Middle schoolers complete a lab in order to discover if the length of a viewing tube, its diameter, or the distance from an object affect the type of data collected and the resulting graph.
Curated OER
Testing Carving Tools
Students onstruct an ancient bow drill and compare its effectiveness at carving stone to marks made by other tools. They perform a careful analysis of the performance of each tool.
Curated OER
Walking the Plank
Eighth graders experiment with a bathroom scale, books and a plank to determine how weight readings change as distance is applied. They graph and interpret the results.
Curated OER
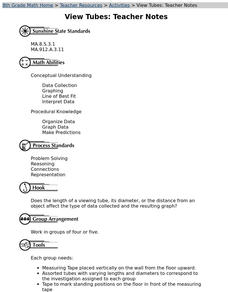
View Tubes
Eighth graders decide if the length of a viewing tube, its diameter, or the distance from an object affects the type of data collected and the resulting graph through a series of experiments.
Curated OER
Cams
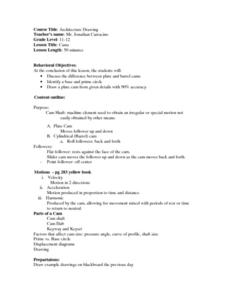
Students explore plate and barrel cams. They discuss the differences between the two cams. Students identify a base and prime circle and they draw a plate cam using the provided details.
Curated OER
Mathematical Techniques - Basic Graphing
Students are introduced to significant figures and how to add, subtract, multiply and divide them. In a group, they practice plotting data points from a table to a graph and labeling all axes. They calculate the slope and y-intercept and...
Curated OER
Compare Your Air
Students will compare the data for different locations that they select and investigate trends over the course of a number of years. This will give the students an opportunity to apply statistical measures (mean, median,mode) to data...
Curated OER
TIMELINE OF THE LAND
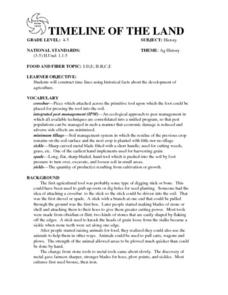
Pupils construct time lines using historical facts about the development of agriculture. Students research specific dates and events and report their findings to the class. Pupils tape or glue the sections together sequentially in a...
Curated OER
Math- A Level Differentiated Lesson
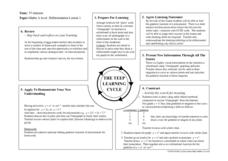
Young scholars investigate the gradient function of a polynomial and they conduct a class discussion about its meaning. Then students use graphing software in order to examine tangents that can be seen visually to aid those who need...
Curated OER
Review For Test On Chapter 5
Students engage in a study of various concepts in relation to preparing for a calculus exam. They sketch and discuss and sketch a variety of functions. The lesson includes an outline of review that should be used by the teacher before...


