Curated OER
Scatter Diagrams and Curve Fitting
In this Scatter Diagrams and Curve Fitting worksheet, students are guided in how to graph a scatter diagram (plot) and a Best Fit Line using a TI-83 graphing calculator.
Virginia Department of Education
Line of Best Fit
Pupils work through a guided activity on fitting a linear equation to a set of data by entering the data into a calculator and trying to envision a line of best fit. They then have the calculator determine the least-squares line and...
Virginia Department of Education
Curve of Best Fit
Which function models the data best? Pupils work through several activities to model data with a variety of functions. Individuals begin by reviewing the shapes of the functions and finding functions that will fit plotted data points. By...
Virginia Department of Education
Linear Curve of Best Fit
Is foot length to forearm length a linear association? The class collects data of fellow scholars' foot length and the length of their forearms. They plot the data and find a line of best fit. Using that line, they make predictions of...
Shodor Education Foundation
Overlapping Gaussians
Adjust the overlap to compare probabilities. Using sliders, learners adjust the shape of two Gaussian curves. The interactive calculates the area of the left tail for one curve and the right tail for the other. Pupils set the interactive...
Curated OER
Curve Fitting
Pupils investigate linear, quadratic, and exponential regressions. They plot sets of data points, determine the regression equation that best fits the data and lastly investigate the coefficient of determination.
Curated OER
Curve Fitting and the TI-85 Calculator
Seventh graders follow a step-by-step guide for using graphing calculator to determine equations which best fit data graphed. They gather data from various sites on the web, or they do searches to find information necessary to complete...
Virginia Department of Education
Quadratic Curve of Best Fit
Class members create a table of the number of chords that can be drawn given the number of points on a circle. Pupils analyze the data created, find a function to fit to it, and use the function to make further predictions.
Alabama Learning Exchange
I'm Lovin' It: Finding Area Between Curves
Students explore the concept of finding the area between two curves. In this finding the area between two curves instructional activity, students model the logos of McDonalds, Nike, and Motorola on grid paper. Students find functions to...
Radford University
Pollution and Curves of Best Fit
Don't put the resource on curves of best fit out on the curb. Using researched data on trash and recycling, scholars create scatter plots and regression curves to analyze the information. As a culminating activity, they complete projects...
Radford University
Can I Create a Line/Curve of Best Fit to Model Water Drainage?
Learners collect data on the amount of water left in a bottle over time. They graph the data to determine whether the scatter plot shows a curved or straight relationship. Group members then determine an equation for the curve of best...
Shodor Education Foundation
Data Flyer
Fit functions to data by using an interactive app. Individuals plot a scatter plot and then fit lines of best fit and regression curves to the data. The use of an app gives learners the opportunity to try out different functions to see...
Radford University
Curve of Best Fit
Don't watch the resource go down the drain. Scholars perform an experiment where they measure the amount of water that flows from a funnel over time. They use the data to create graphs and find the curves of best fit.
Curated OER
Lines of Best Fit
High schoolers explore the concept of line of best fit. In this line of best fit lesson, students find lines of best fit in examples about riding your bike home from school and dentistry. High schoolers find two data points and find the...
Curated OER
Lines of Best Fit
Students determine if there is an associationm in a scatter plot of data. They analyze data through predictios, comparisons, and applications. Students calculate the line of best fit using a graphing calculator. They display data in...
Curated OER
Vernier EasyData App
Used along with data collection devices, the EasyData Application for the TI-83 Plus/TI-84 calculator allows learners to use real data to learn math and science. Statistics, curve fits, and integrals are used to analyze the collected...
National Council of Teachers of Mathematics
National Debt and Wars
Take a functional approach to the national debt. Learners collect information about the national debt by decade and plot the data. They determine whether an exponential curve is a good fit for the data by comparing the percent changes...
Curated OER
Comparison of Two Different Gender Sports Teams - Part 3 of 3 Scatter Plots and Lines of Best Fit
Learners create a scatter plot for bivariate data and find the trend line to describe the correlation for the sports teams. In this scatter plot lesson, students analyze data, make predictions,and use observations about sports data...
Shodor Education Foundation
Normal Distribution
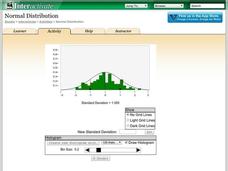
Does the size of the bin matter? The resource allows pupils to explore the relationship between the normal curve and histograms. Learners view histograms compared to a normal curve with a set standard deviation. Using the interactive,...
Houston Area Calculus Teachers
Area and Volume
An AP calculus lesson begins with an activity to determine the volume of a solid using a cross-section. Next, learners review the ways to find the area between two curves , as well how to find the volume of a solid created from the...
Radford University
Body Measurement Activity
Don't keep the resource at an arm's length. A hands-on activity has scholars measure the heights, arm spans, hair lengths, and foot lengths of their classmates. They create scatter plots to determine if there is a correlation between...
Bowland
Keeping the Pizza Hot
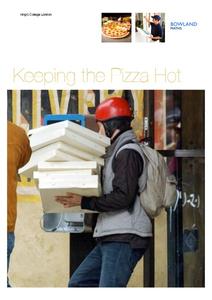
Learners conduct an experiment to develop a cooling curve for pizza. They consider how this affects pizza delivery in terms of packing material, distance, and delivery routes.
Curated OER
Rainbows, Bridges & Weather, Oh My!
Explore how real-world applications can be parabolic in nature and how to find quadratic functions that best fit data. A number of different examples of modeling parabolas are explored including a student scavenger hunt, the exploration...
Curated OER
How popular is your favorite site?
Students gather data for the project for the entire year. They plot their data, try to fit a equation to their data, and speculate on why the data shows the pattern it does and project its future growth.


