Inside Mathematics
Graphs (2006)
When told to describe a line, do your pupils list its color, length, and which side is high or low? Use a worksheet that engages scholars to properly label line graphs. It then requests two applied reasoning answers.
Virginia Department of Education
Work and Power
Assist your class with correctly calculating the values for force, work, and power as they determine the amount various activities require. They gather data and participate in a group discussion to compare results upon conclusion of the...
Curated OER
Academic Grade 9 Assessment of Mathematics: Algebra I and Geometry
Test your class, or use this 12 page math packet as chapter review. They solve 21 multiple choice problems which require them to graph linear equations, find the volume of prisms and cones, find unknown angles, and determine...
Bowland
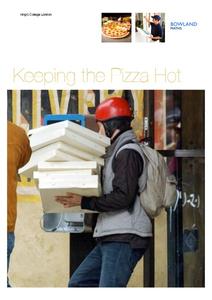
Keeping the Pizza Hot
Learners conduct an experiment to develop a cooling curve for pizza. They consider how this affects pizza delivery in terms of packing material, distance, and delivery routes.
Curated OER
When Dinosaurs Ruled the World
Students graph the varying sizes of dinosaurs. In this math and dinosaur lesson, students view dinosaur models and compare the different shapes and sizes of the dinosaurs. Students complete a dinosaur math activity, read The...
Curated OER
Scatter Diagrams and Curve Fitting
In this Scatter Diagrams and Curve Fitting worksheet, students are guided in how to graph a scatter diagram (plot) and a Best Fit Line using a TI-83 graphing calculator.
Curated OER
Line Best Fit
Students identify the line of best fit. In this statistics lesson, students analyze graphs and plots to identify positive, negative or no correlation. They find the line of best fit for different scatter plots.
Curated OER
Linear Patterns in Data
Eighth graders extend their learning of graphing linear equations and are introduced to connecting patterns in tables and graphs to represent algebraic representations. They then determine patterns and extrapolate information from these...
Curated OER
The Phone Bill Problem
Students write an equation for a linear function. In this algebra lesson, students collect data, plot it and graph it. They identify the equation of the graphed data and define the slope and y-intercept of the graph.
Houghton Mifflin Harcourt
Unit 3 Math Vocabulary Cards (Grade 5)
Fifty-four flashcards make up a set to help reinforce math vocabulary. The set offers two types of cards; a word card printed in bold font, and a definition card equipped with an example and labels. Terms include capacity,...
Beyond Benign
Water Bottle Unit
How much plastic do manufacturers use to create water bottles each year? The class explores the number of water bottles used throughout the years to determine how many consumers will use in the future. Class members compare different...
Curated OER
Business & Statistics: Final Exam
In this business and statistics worksheet, learners read real-life business problems, arrange data, and identify the probability method best used to determine the answer. They identify the type of random sample, draw stem-and-leaf plots,...
National Wildlife Federation
I Speak for the Polar Bears!
Climate change and weather extremes impact every species, but this lesson focuses on how these changes effect polar bears. After learning about the animal, scholars create maps of snow-ice coverage and examine the yearly variability and...
Curated OER
M&M Exponential Activity
Young scholars create a scatter plot of their experimental data. In this algebra lesson, students use M&M's to determine an algebraic model. They discuss results in class.
Curated OER
Statistical Accuracy and Reliability
Ninth graders assess the accuracy and reliability of current survey data and how it is represented. They design a survey, collect data, and use technology to analyze the data and present the results. Students examine scatter plots and...
Curated OER
Graph and Compare the Adventure's Temperature Vs. Local Temperature
Learners explore the concept graphing data. In this graphing data lesson, students use weather data from their local weather and some other city and graph them. Learners plot the local weather vs. another city. Students record...
Curated OER
Commercial Salmon Fishing
Students work with data about commercial fishing ofsalmon in Alaska. Students gather data, graph it, and analyze it.
Alabama Learning Exchange
Jelly Beans Add Up
Students explore counting, sorting, and graphing skills. For this data analysis lesson, students sort jelly beans by color, count the jelly beans, and create a bar graph of the jelly beans according to color.
Curated OER
Statistics with State Names
Students analyze the number of times each letter in the alphabet is used in the names of the states. In this statistics lesson, students create a stem and leaf plot, box and whisker plot and a histogram to analyze their data.
Curated OER
Venn Diagram and UK Basketball
Students analyze data and make inferences. In this algebra lesson, students collect and analyze data as they apply it to the real world.
Curated OER
Project Interactive--Stem and Leaf Plotter
In this excellent stem and leaf plotter worksheet, students construct, arrange and write a report of how to interpret the leaves they collect in this data analysis. Students answer 4 detailed questions regarding the data analysis...
Curated OER
The Big Bang-Hubble's Law
In this Hubble's law learning exercise, students use data for galaxies which include their distance and speed. Students make a graph to show the distance to each galaxy and the speed of each galaxy. They use their graph to answer 4...
Curated OER
Decisions, Decisions, Decisions
Students examine graphs to find the most appropriate for various kinds of data. In this graphing lesson, student create bar, line and circle graphs. Students create graphs electronically and manually interpreting the data.
Curated OER
Linear and Exponential Models
Students investigate the differences between linear and exponential models. In this linear and exponential models lesson, students make a table of given data. Students determine if the data is linear or exponential by...


