Howard Hughes Medical Institute
Measuring Biodiversity in Gorongosa
Take your biology class' understanding of biodiversity to a whole new level! Ecology scholars use data to calculate three different diversity indices based on the organisms in the Gorongosa National Park. The four-part activity uses an...
Teach Engineering
Backyard Weather Station
Challenge young meteorologists to apply their knowledge of weather to build their own weather stations. The resource provides the directions to build a weather station that contains a wind vane, barometer, thermometer, and rain...
Curated OER
Fire Wars
Your class can practice collecting and analyzing data. They extrapolate information and derive data from fire season statistics. They also choose the most appropriate format to display collected data.
National Wildlife Federation
Quantifying Land Changes Over Time Using Landsat
"Humans have become a geologic agent comparable to erosion and [volcanic] eruptions ..." Paul J. Crutzen, a Nobel Prize-winning atmospheric chemist. Using Landsat imagery, scholars create a grid showing land use type, such as urban,...
Nuffield Foundation
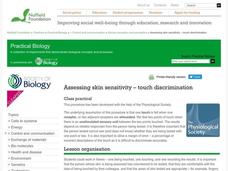
Assessing Skin Sensitivity—Touch Discrimination
How do we distinguish between the number of things touching our skin? Scholars explore an interesting lesson plan through an experiment. They learn that there must be an unstimulated sensory unit between two touches to distinguish them....
NASA
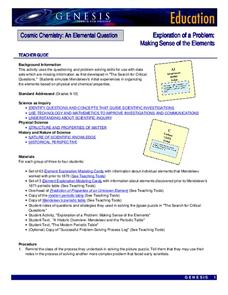
Exploration of a Problem: Making Sense of the Elements
When given too much data to simply memorize, it helps to sort it into manageable groups. The second lesson in the six-part series of Cosmic Chemistry challenges groups of pupils to take a large amount of data and figure out how to best...
Curated OER
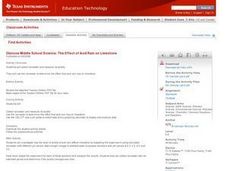
The Effect of Acid Rain on Limestone
Pupils investigate the pH of rain water in this earth science lesson. They collect rain water from their area and explore the pH when lime stone is added, then they will use the data collected to conjecture as to the effect of acid rain...
Curated OER
Management of Wildlife Resources
Learners investigate how wildlife management policies affect the size of large animal populations. They develop a spreadsheet that incorporates a mathematical model to predict big game herd sizes, and using worksheet data manage a bison...
Curated OER
Tables, Charts and Graphs
Students examine a science journal to develop an understanding of graphs in science. In this data analysis lesson plan, students read an article from the Natural Inquirer and discuss the meaning of the included graph....
Virginia Department of Education
The Germ Theory and Koch’s Postulates
Explore the history of cholera and its effect on society with your biology class. Young biologists will then proceed to grow their own germs, prepared from live cultures, and follow the steps of the scientific method to generate data....
Curated OER
When the Snow is as High as an Elephant
High schoolers study the concept of mean values using a data plot. Learners enter the given data in the activity to create their data table. They use the data table to calculate the mean of the snowfall percentage provided in the...
Texas Instruments
Light and Day
Pupils explore the concept of collecting data as they collect data on their graphing calculator about time, temperature, and light. Learners plot the data and create histograms and box and whisker plots to analyze the data.
Discovery Education
Sonar & Echolocation
A well-designed, comprehensive, and attractive slide show supports direct instruction on how sonar and echolocation work. Contained within the slides are links to interactive websites and instructions for using apps on a mobile device to...
Curated OER
Results and Conclusions
Fourth graders practice using the scientific method. In this results and conclusions lesson, 4th graders review data collected, create a graph of their data and make their final conclusions about the information collected.
Curated OER
How Dense is Salt Water?
Young schoolers explore the concept of linear regression. They determine the mass and density of salt water. Pupils add salt to water and record the density as salinity increases, and perform a linear regression on the data to model the...
Pace University
Grade 7 Earth Day Statistics with Circle and Bar Graphs
Take a tiered approach to studying waste. The lesson uses Earth Day to present differentiated instruction around using circle and bar graphs. Each group gets a cube based on their tiers and works collaboratively as well as individually...
Cornell University
Fibers, Dyes, and the Environment
Nanofibers can be made through electrospinning or force spinning in order to reduce the negative impact on the environment. Pupils study the role of fibers and dye on the environment through a series of five hands-on activities. Then,...
National Wildlife Federation
Lights, Camera, Action! Conducting an Energy Audit
Thirty percent of energy used by schools is used inefficiently! Part two in the series of 12 has groups perform energy audits of their schools as part of the Cool Schools Challenge. Each group is assigned a specific room, performs the...
Curated OER
Nutria And The Disappearing Marsh
Young analysts examine changes in the nutria population, vegetation density, and marsh area over time in the wetlands of Louisiana. They import data and use the TI-73 Explorer to graph and analyze the effects of nutria on marsh loss.
Texas Instruments
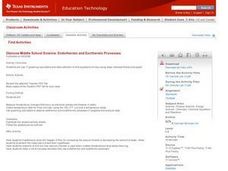
Endothermic and Exothermic Processes
Young scholars investigate temperature using the TI. In this chemistry lesson, students analyze the change in temperature, as chemicals are dissolved in water. They analyze data collected using the CBL 2.
Chicago Botanic Garden
Personal Choices and the Planet
How big is your footprint? Activity three culminates the series by having groups complete carbon footprint audits with people in their schools and/or around the districts. Groups then gather their data, create a presentation including...
Curated OER
Tale of a Tuna
Junior marine biologists access the International Commission for the Conservation of Atlantic Tunas' data on Atlantic Bluefin Tuna catches. As they analyze the data, they answer three questions. Background information and links to...
Howard Hughes Medical Institute
Population Dynamics
Will human population growth always be exponential, or will we find a limiting factor we can't avoid? Young scientists learn about both exponential and logistic growth models in various animal populations. They use case studies to...
Curated OER
Garbage Pizza
Fourth graders explore the concept of waste management. In this recycling lesson, 4th graders identify materials that must be landfilled as well as items that may be recycled or reused.


