Curated OER
Rockefeller's Revenge: Exxon and Mobil Unite
Study the impact and possible outcomes of the Exxon-Mobil merger in your language arts, social studies, or economics class. Secondary learners evaluate a series of graphs, write a paragraph interpreting the data, and engage in class...
Curated OER
Data Analysis
In these data analysis worksheets, students complete 4 worksheets of activities for analyzing data. Students use the mean, median, mode, and range to organize the data.
Curated OER
All About Graphs
Students practice organizing data by creating graphs. In this statistics lesson, students survey the class about favorite colors and create a bar graph using the data. Students complete a test based on pet and animal statistics.
Curated OER
Looking at Data
Third graders use two days to create, collect, display and analyze data. Classroom activities and practice build greater understanding to a variety of forms used to display data.
Baylor College
Body Strength
Your young learners will discover how muscular strength and endurance can increase with this truly hands-on activity! Beginning by writing an acrostic for the word strength, class members then engage in tracking their ability to squeeze...
Committee for Children
Students Learn to Stop Rumors Before They Start
Two activities look at how rumors are spread and ways class members can stop them. The first activity brings forth an in-depth conversation about how reporters gather information to write articles and how students can implement the same...
Curated OER
Arthur Young and the President
Students work with NASS data by converting it into prose. In this historical agriculture information lesson, students read about how George Washington communicated information about crop yields, livestock, and land values. They apply the...
Curated OER
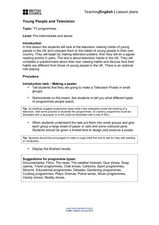
Young People and Television
Students explore communication by participating in a role playing lesson. In this media analysis lesson, students answer surveys about their own television watching habits and compare them to the rest of the class. Students complete...
Curated OER
Dear George Using Census Data
Sixth graders discuss differences in the way in which information was disseminated in George Washington's time and how it is acquired in contemporary times. They examine Census of Agriculture data and a modern day version of a letter...
Curated OER
Gummy Bear Math
First graders predict, collect data, and create a graph based on gummy bear colors they are given. For this graphing lesson plan, 1st graders first predict how many colors of gummy bears there are. They then count the colors, graph them,...
Curated OER
Converting Units Of Length
Use this converting units of length worksheet to have your charges fill out a table, find the perimeters to three shapes and calculate the answers to three word problems.
Centers for Disease Control and Prevention
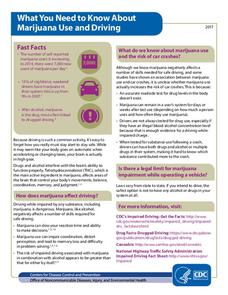
What You Need to Know about Marijuana Use and Driving
Research indicates that marijuana can negatively affect coordination and judgment, making it dangerous to drive while under the influence. But does it increase the risk of car crashes? An informative fact sheet describes the ways...
Curated OER
All About Aid
Begin this instructional activity by estimating the cost of a college education and comparing it to actual data. After reading an article, high school seniors discuss the processes of the college loan corporations. They listen to a...
Curated OER
Create a Public Opinion Survey: The Middle East in the News
Though the discrete content here is a pair of New York Times articles about a 1998 military strike on Iraq and the coincident impeachment by the House of Representatives of then-President Clinton, this detailed plan for creating,...
Curated OER
The Guise of a Graph Gumshoe
Eighth graders practice constructing bar, circle, and box-and-whisker graphs. They practice reading and interpreting data displays and explore how different displays of data can lead to different interpretations.
Curated OER
We Are Having a Party! Part I
Second graders use data analysis skills in order to plan a class party. They graph possible times for the party noting the range for times. They discuss how mathematicians find and use the range to analyze data.
Curated OER
How Many Letters Are In Your Name?
Students discover how to make a graph that represents the number of letters in their names. In this early childhood math lesson plan, students collect data, categorize data, and develop skills to analyze the pieces of data.
Shmoop
ELA.CCSS.ELA-Literacy.SL.9-10.2
What are diverse media formats? Have your class figure this out on their own through small-group brainstorming. The resource includes two related activities about different kinds of data that will help your class get a grasp of media...
Curated OER
How Diverse is That?
Compare various types of biological diversity in a coral reef and calculate a numeric indicator that describes the diversity found in coral communities. Your class can work in groups to look at the abundance and distribution data of...
Curated OER
Loving Literature
First graders, after having "Are You My Mother?" by P.D. Eastman read to them, participate in group discussions or independentally work to analyze a spreadsheet to identify essential elements in the story and graph their data. In...
Curated OER
Linguistic Diversity. Languages in Canada - Elementary
Create a language mosaic to reveal the linguistic diversity in your community. Pupils interview a person with a home language other than English and contribute to a bulletin board display representing the variety of languages spoken. The...
Curated OER
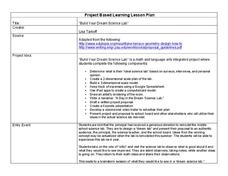
Build Your Dream Science Lab
Would your ideal science lab be filled with bubbling beakers and zapping Tesla coils? Or would it contain state-of-the-art computer technology and data analysis? Dream big with an innovative lesson that connects math and language...
Curated OER
Lesson Plan: The Net Neutrality Debate
Should Internet users who send data-heavy content pay higher fees than those who are involved in activities, like sending an email, that have less content? This question is at the heart of the Net Neutrality debate. After watching a PBS...
Curated OER
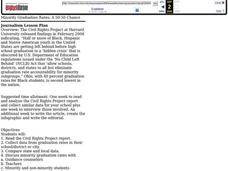
Minority Graduation Rates: A 50-50 Chance
Students conduct research on issues and interests by generating ideas and questions and by posing problems. They gather, evaluate and synthesize data from a variety of sources. In this lesson the issue is minority graduation rates.


