Curated OER
Walking the Plank
This is a cool math activity. Kids collect and interpret data based on a physical act. A board is balanced between a scale and a step, learners record a peer's weight as it decreases while s/he walks further away from the scale. They...
EngageNY
Understanding Variability When Estimating a Population Proportion
Estimate the proportion in a population using sampling. The 20th installment in a series of 25 introduces how to determine proportions of categorical data within a population. Groups take random samples from a bag of cubes to determine...
CCSS Math Activities
Social Security Trust Fund
Will Social Security still be around when you retire? Given data on the predicted balance of the social security fund over time, scholars plot the points on a coordinate grid and determine if a quadratic regression fits the data. They...
EngageNY
Modeling a Context from Data (part 1)
While creating models from data, pupils make decisions about precision. Exercises are provided that require linear, quadratic, or exponential models based upon the desired precision.
Curated OER
Scientific Data-The Gift That Keeps on Giving!
In this scientific data worksheet, students solve 6 problems related to the data to be collected by the Solar Dynamics Observatory Mission. The problems include finding the number of bytes necessary in discs and drives to store a given...
Curated OER
Data Analysis
In these data analysis worksheets, students complete 4 worksheets of activities for analyzing data. Students use the mean, median, mode, and range to organize the data.
Illustrative Mathematics
Modeling London's Population
Looking at London's population from 1801–1961 in 20 year increments, high school mathematicians determine if the data can be modeled by a given logistic growth equation. They explain their thinking and determine the values of each...
Have Fun Teaching
Scientific Method
Encourage your students' inner scientist by conducting experiments and recording their findings. This printable incorporates every part of the scientific method into an easy-to-read outline of experimental questions, research,...
Curated OER
Using Random Sampling to Draw Inferences
Emerging statisticians develop the ability to make inferences from sample data while also working on proportional relationships in general. Here, young learners examine samples for bias, and then use random samples to make...
Curated OER
Interpreting Your Data
In this water quality sampling worksheet, students organize and analyze their data from samples they have collected. After analyzing based on 9 guide questions, they complete 18 short answer questions about fish, benthic, and plant...
Curated OER
Reading Graphs
Encourage kids to read line graphs with confidence using these examples and accompanying comprehension questions. Learners examine two graphs and answer four questions about each. This is definitely intended for beginners to this type of...
Curated OER
Converting Units Of Length
Use this converting units of length worksheet to have your charges fill out a table, find the perimeters to three shapes and calculate the answers to three word problems.
Big Kid Science
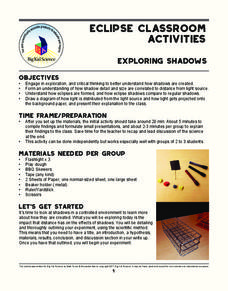
Exploring Shadows
What's that lurking in the shadows? An activity that demonstrates how eclipses happen. Science scholars investigate how light and distance interact to form shadows. The experiment uses simple materials to generate data and observations...
Curated OER
Heads & Tails Data Collection
In this data collection instructional activity, students use a penny and a dime to play a math game. Students flip the money in the cup and then record the number of heads and tails showing marking the coins in the box.
EngageNY
Describing the Center of a Distribution
So the mean is not always the best center? By working through this exploratory activity, the class comes to realize that depending upon the shape of a distribution, different centers should be chosen. Learners continue to explore...
Federal Reserve Bank
What Do Financial Market Indicators Tell Us?
Explain the four categories of financial indicators (commodity prices, stock indexes, interest rates, and yield spreads), and help your class members understand how changes in this data can affect decisions regarding consumer spending,...
Shmoop
ELA.CCSS.ELA-Literacy.SL.9-10.2
What are diverse media formats? Have your class figure this out on their own through small-group brainstorming. The resource includes two related activities about different kinds of data that will help your class get a grasp of media...
Virginia Department of Education
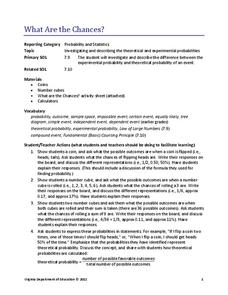
What Are the Chances?
Take a chance on an informative resource. Scholars conduct probability experiments involving coins and number cubes to generate data. Compiling class data helps connect experimental probability to theoretical probability.
Willow Tree
Linear Relationships
There's just something special about lines in algebra. Introduce your classes to linear equations by analyzing the linear relationship. Young mathematicians use input/output pairs to determine the slope and the slope-intercept formula to...
Curated OER
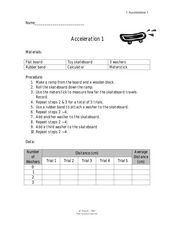
Acceleration 1
In this acceleration worksheet, students use weights to increase the mass affecting the force on moving objects. Students plot a graph of their data and answer 3 questions about how the acceleration of the toy skateboard used in the...
Curated OER
Graphs
In this graphs worksheet, students solve and complete 9 various types of problems. First, they use a large scatter graph to complete a described trend in data. Then, students find the difference of negative numbers and place them in...
Curated OER
Student - Designed Density Experiment and Poster
In this student-designed experiment worksheet, middle schoolers decide on an experimental problem to solve. Students use the scientific method to perform an experiment and record the data. Middle schoolers calculate the density of liquid...
MEP: Demonstration Project
Unit 5 Probability Activities
Wow! Here is a 14-page package of activities to use when your math class is studying probability. There are a myriad of pertinent experiments for learners to try, such as rolling a self-constructed multi-faced three-dimensional...
Curated OER
How Do Astronomers Measure Distances to Stars?
In this astronomy activity, students participate in an activity using the parallax effect to measure star distances. They record their information in a data table then complete 5 fill in the blank conclusion questions.


