Curated OER
Education for Global Peace
Fifth graders construct data graphs based upon sets of data. In this graphing lesson, 5th graders read the text If the World Were a Village and discuss how types of graphs accurately represent a large population. Students construct their...
Curated OER
Mapping the Census
Students learn why the census makes a difference. In this U.S. Census lesson plan, students learn the key elements of cartography, examine the difference between data and their representation, and create a map using census data.
Curated OER
Why We Count
Students visualize census data on a map and use a map key to read a population map. In this census lesson, students use a map of the Virgin Islands and corresponding worksheets to gain an understanding of population density.
Curated OER
Cities
Students examine U.S. Census figures. In this urban centers lesson, students compare city populations across the span of 50 years. Students create line graphs based on the data.
Curated OER
Taking an Animal Census Grades 3-8
Students comprehend the competitive, interdependent, cyclic nature of living things in an environment. They conduct an animal census in a designated research area over a six-month period to determine what types of species are present,...
Anti-Defamation League
The Gender Wage Gap
"Equal pay for equal work!" may sound logical but it is not the reality. High schoolers begin a study of the gender wage gap with an activity that asks them to position themselves along a line that indicates whether they strongly agree...
Curated OER
Where Do I Live?
Students gain a better understanding of the population of the region they live in by comparing U.S. census data on the internet.
Curated OER
Technology - Data Collection
Students collect and analyze data from the United States Census Bureau. Using spreadsheet technology, students explore their results and make preductions about income groups. Students compute the mean, median and mode. They create...
Curated OER
Graphically Speaking
Students discover the links between population and Congressional representation. In this government lesson, students research population statistics and create spreadsheets that compare population to the number of Congress members per state.
Curated OER
A look at our larger population
Student team together to tell the story of the U.S.'s rapid population growth. High schoolers research census changes, focusing on changes in the size of the community and the school. Students tell the story by writing articles and...
Curated OER
Classroom Census
Students identify the processes involved in data collection. They decide how census data can be used. Students engage in the data collection process and represent and interpret classroom data. They use scattergrams, arrow diagrams, block...
Curated OER
Senior Classroom Census
Students recall the data collection cycle and engage in the data collection process. They record data, represent it in graphical form and anlyze and question the data. In addition, they decide how census data can be used for
planning.
Curated OER
Samples and Stats
Young scholars explore different methods of taking surveys and conducting polls and examine these methods for bias. They design and administer a sample survey, analyze the data and present their findings to the class.
Curated OER
Exploring Racial and Ethnic Diversity
High schoolers explore and examine racial and ethinic diversity in the metropolitan areas of the United States. They examine data from the US Census Description of Race and Ethnic Categories. Students explore the population by race and...
Curated OER
Was There an Industrial Revolution? New Workplace, New Technology, New Consumers
Students examine the changes in the U.S. in the period of industrialization before the Civil War. They analyze census data, list/describe inventions and innovations, explore various websites, conduct a Factory Simulation activity, and...
Kenan Fellows
Lego Thinking and Building
Run a simulated airplane manufacturing plant with your pupils as the builders! Learners build Lego airplane models and collect data on the rate of production, comparing the number produced to the number defective. Using linear...
Curated OER
US Households
Learners construct and use inverse functions to model a real-world context. They use the inverse function to interpolate a data point.
Curated OER
US Population 1982-1988
Your algebra learners make predictions using the concepts of a linear model from real-life data given in table form. Learners analyze and discuss solutions without having to write a linear equation.
Curated OER
District Decisions
Learners review census data and examine the manner in which reapportionment and redistricting occurs. They, in groups, debate a proposed change in the way congressional districts are drawn and present their debates to the class.
Curated OER
Analysing 2001 Census Microdata
Eighth graders examine the census data of 2001. In this American History lesson, 8th graders analyze data using one- and two-variable statistical analysis. Students develop a research question that makes use of the...
Curated OER
Ohio Census 1990 & 2000
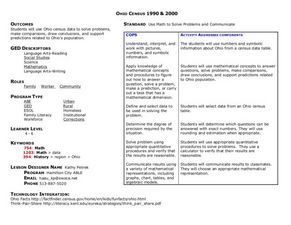
Students use Ohio census data to solve problems, make comparisons, draw conclusions, and support predictions related to Ohio's population. They interpret and work with pictures, numbers and symbolic information.
Curated OER
Ohio Census 1990 and 2000
Students begin the lesson plan by examining Census data from the state of Ohio from 1990 and 2000. Using a worksheet, they solve problems using the data and a calculator. They share their responses with the class and discuss what the...
Curated OER
What's the Point?
High schoolers learn why the census makes a difference. In this U.S. Census lesson plan, students identify who uses census data and how, trace the impact of census data from Census 2000, and present findings in a graphic format.
Curated OER
Analyzing the Job Market for Babysitting in Your Neighborhood
Young scholars conduct research on a neighborhood in Canada. In this data analysis lesson, students use data from the 2006 Canadian census to draw conclusions about a population group.
Other popular searches
- Data, Census, & Statistics
- Census Data
- Census Data Analysis
- Analyzing u.s. Census Data
- Analyzing Census Data
- Data Census & Statistics
- Graphing Census Data
- United States Census Data
- Graphing Using Census Data
- 2010 Census Data
- Census Data 1860s
- Historical Census Data Browser


