Curated OER
Shaquille O'Neal Hand & Foot Span
If Shaquille O'Neal wears a size-20 shoe, how big are his hands? Learners will use the average ratios of foot length to hand span to calculate the hand span of Shaq, but first, they have to collect the data! They will...
Curated OER
Data Sampling
Students discover data sampling. In this science lesson plan, students explore data sampling and turn the data collected into useful information by making graphs and using them to solve problems.
Curated OER
Red Worms Rock!
Second graders measure red worms. In this lesson plan, 2nd graders observe and collect data on red worms. Students measure the red worms and create a graph with the data they collect.
Curated OER
A Day at the Beach
Help learners determine the rate of change for the temperature of sand. They will collect data on the temperature of wet and dry sand over time with a heat lamp overhead. Then make a scatter plot of the data and find a linear model to...
Virginia Department of Education
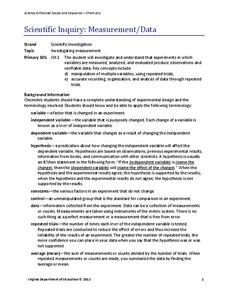
Scientific Inquiry: Measurement/Data
While pupils design their own lab experiments, they will not form a new species. Scholars take their materials and design an experiment regarding reaction rates.
Curated OER
Residential Power System
Perform data analysis on energy consumption to apply algebraic expressions to the real world. Learners will write and solve equations that answer various questions from residential power use. They will collect data at home and calculate...
Curated OER
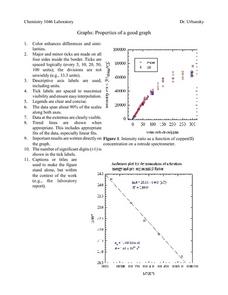
Properties of a Good Graph
In this chemistry worksheet, students examine the common characteristics of an acceptable graph that is meant to be used to display data.
Curated OER
Physical Science: Festival of Bubbles
Investigate bubbles through the use of scientific inquiry. Pupils blow bubbles using several methods and measure the resulting bubble print. Measurements are recorded on a data table and transferred to a bar graph. Results are discussed...
American Statistical Association
How Long Are the Words in the Gettysburg Address?
It's 268 words, but one only needs to consider 10 of them at a time. A data collection and analysis activity has learners investigate the lengths of words in the Gettysburg Address. They first self-select a sample of 10 words and...
Curated OER
Identifying Ozone Variations over Different Locations
Students analyze ozone data. In this atmosphere lesson, students will use a NASA resource to gather data for different regions of the Earth. Students will then create a graph for their data and answer related questions.
Curated OER
Exploring Seasonal Shadows and Sunlight
What can shadows tell us about the changing season? Over several months, astronomy learners record length and position of an outdoor object's shadow, such as a flagpole. They apply the data to a growing hypothesis and note the...
Curated OER
It's Your Life - Safe or Sorry/Safety Issues
Middle schoolers examine and chart data about safety hazards and unsafe situations. In this safety hazard instructional activity, students examine newspapers and web sites to investigate injuries from safety hazards. They make a...
PBS
Investigating Seasonal Temperature and Precipitation Variations
Weather seems unpredictable, but is it really? Learners collect weather data from online interactives and build data displays. They use their displays to identify temperature and precipitation patterns in different areas.
American Statistical Association
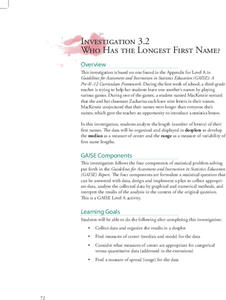
Who Has the Longest First Name?
Name that statistic! Classmates each write their name and the number of letters in it on a sticky note to place on the board. As a class, they determine the median, mode, and range of the name lengths, and create a dot plot of the data....
Curated OER
Data Lesson Vital Information
Students prepare and collect data and use excel and create a graph. They collect data about the number of pattern blocks that are put on tables. Students then record that data in Excel.
Curated OER
The Gathering and Analysis of Data
Young mathematicians gather data on a topic, graph it in various forms, interpret the information, and write a summary of the data. They present their data and graphs to the class.
Curated OER
Collecting Data and Graphing
Young mathematicians collect data and graph it. They work collaboratively to collect data regarding the span of arm length versus height and graph the data they collect.
Curated OER
"Lucky Charms": Interpreting Data and Making Predictions
Seventh graders determine if a "lucky charm" will increase their chances of winning a game. Students calculate the experimental probability of each player in a game. They observe and collect data from each activity. Students compare the...
Curated OER
Graphing Iron Data
Students apply a data set to create a graph show how iron ore impacts an ecosystem. They explain how the iron effects the distribution and abundance of phytoplankton in coastal ecosystems using spreadsheet software.
Curated OER
Rockin' Data
Fifth graders are given the questions, "What type of music would you suggest the manager place in front of the store?". Students collect data by talking with 20 adults and create a bar graph on the computer to present the data.
Curated OER
What's Up With My Class
Learners collect data about their class and they use Excel spreadsheet to display their tables and graphs about the class. They answer survey questions and collect their data. Students create a graph of their choice to display the...
Curated OER
Ozone and Temperature Data Analysis, South Pole Antarctica
Young scholars discuss the layers of the atmosphere, and the history of the ozone hole. They discuss the chemistry of the ozone formation. Students compare seasonal data collected with ozonesondes. They compare Antarctic and Arctic ozone...
Curated OER
Populations Lab - Cultures Lesson: Statistics / Sampling Patterns
Ninth graders examine the application of statistical sampling, data collection, analysis, and representation that exists in schooling and teenage lifestyles in Japan and the United States.
Polar Trec
Ozone Data Comparison over the South Pole
Did you know the hole in the ozone is seasonal and filled by January every year? The lesson uses scientific measurements of the ozone over the South Pole to understand patterns. Scholars learn that the hole grew bigger annually before...
Other popular searches
- Collecting and Recording Data
- Collecting and Organizing Data
- Collecting and Graphing Data
- Collecting and Using Data
- Games on Data Collecting
- Collecting Weather Data
- Collecting and Comparing Data
- Patterns Data Collecting
- Math Data Collecting
- Patterns, Data Collecting
- Collecting and Charting Data
- Patterns\, Data Collecting


