Curated OER
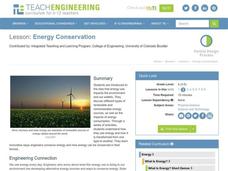
Energy Conservation
Students investigate energy conservation. In this energy conservation and analyzing data lesson, students identify and explain several energy sources and research renewable and nonrenewable energy sources. Students use statistics form...
Curated OER
Trash to Gas
Students experiment with biomass materials as alternative energy sources. In this biomass material lesson, students participate in an experiment with cow manure to determine how it can be used as an energy source. They record their data...
Balanced Assessment
Stick Patterns
Sticks and stones may break my bones, but these sticks will make me smarter. Pupils examine arrays of sticks to determine the next array in a pattern. They use the number of sticks added to each previous array to determine a recursive...
Curated OER
Population Growth in Yeasts
Students design an investigation using yeast. In this environmental engineering lesson plan, students design an investigation to determine how environmental factors affect the growth of yeast. They will collect quantitative data and...
Shodor Education Foundation
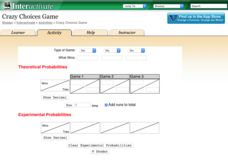
Crazy Choices Game
Wanna take a chance on which game is best? The resource provides three games of chance using multiple types of games. Games range from coin toss to cards. Choosing a type of game, pupils determine what wins and enter the theoretical...
Teach Engineering
Better By Design
Which modification is the best? Using the scientific method, pairs determine the effects of each control surface on the distance of a glider's flight. The activity, section 16 in a 22-part unit on aviation, allows pupils to gain a better...
Curated OER
World of the Pond
Field trip! The class will review what they know about organisms that dwell in freshwater ponds, then trek down to the old water hole to collect specimens for examination. This includes several web links, useful tips, and an excellent...
Sea World
Splash of Math
How can kids use math to learn about marine life? Combine math skills with science lessons in a resource featuring activities about life in the sea. Kids graph and calculate data, solve complex word problems, measure geometric shapes,...
Public Schools of North Carolina
Math Stars: A Problem-Solving Newsletter Grade 5
Looking for a way to challenge the problem-solving abilities of your young mathematicians? Then look no further. This collect of newsletter worksheets engages learners with a variety of interesting word problems that cover topics ranging...
Federal Reserve Bank
Creating a Budget
Learning to create and maintain a budget is an important life skill. Guide individuals in the discovery of their spending habits and how to track them. They then use what they learned to create a budget and make decisions on where they...
Balanced Assessment
Toilet Graph
Mathematics can model just about anything—so why not simulate the height of water in a toilet bowl? The lesson asks pupils to create a graphical model to describe the relationship of the height of the water as it empties and fills again....
101 Questions
Toothpicks
Analyze patterns and build functions. Young scholars work on their modeling skills with an inquiry-based lesson. After watching a video presentation of the problem, they write functions and make predictions.
PBS
The Lowdown — Rot and Rubbish: The Rancid Truth about How Much Food We Waste
Compare waste a percent at a time. The resource contains an infographic on food waste. Using images, the informative activity describes the amount and types of food waste that occur. Pupils compare the percentage of waste from their...
Mathed Up!
Distance Time Graphs
If only there was a graph to show the distance traveled over a period of time. Given distance-time graphs, pupils read them to determine the answers to questions. Using the distance and time on a straight line, scholars calculate the...
Las Cumbres Observatory
How Big is the Solar System?
Find out if it's possible to travel to the edge of the solar system. Learners use a piece of string to model the distance between planets in the solar system. They then use the distances to calculate how long it would take to travel to...
Curated OER
Data Days
Sixth graders practice collecting, organizing and displaying data. They create circle, bar, line and picto graphs. They analyze data in small and large sample groups.
Curated OER
Collect, organize and compare different data for the Marine Mammals of the Miami Seaquarium, i.e.: size, weight, diet and habitat and how to calculate average, median, mode and range.
Learners collect, organize, and compare different data and develop statistical methods such as: average, median, mode and range as a way for decision making by constructing table
Curated OER
Collecting, organizing and comparing data for cellular telephone buying and calculating average, and median price and best deal per cost.
Students research data and develop statistical methods such as mean and median price and make convincing arguments as powerful ways for decision making.
Curated OER
We Are Having a Party! Part I
Second graders use data analysis skills in order to plan a class party. They graph possible times for the party noting the range for times. They discuss how mathematicians find and use the range to analyze data.
Curated OER
Graphic Favorite Breakfast Foods
Second graders graph data based on a class survey of their favorite breakfast foods. For this graphing lesson plan, 2nd graders take a class survey of their favorite breakfast foods. Then they take that data and put it into a computer...
Curated OER
View Tubes
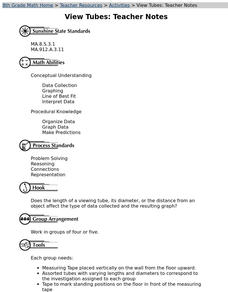
Eighth graders decide if the length of a viewing tube, its diameter, or the distance from an object affects the type of data collected and the resulting graph through a series of experiments.
Curated OER
What's The Teacher's Choice?
Fifth graders explore how to use data and display it using a chart or graph. They use food choices for categories and then gather the data and use the provided chart for display. In small groups students discuss the data and the results.
Curated OER
Paper Tower Challenge
Student explore the challenge of building a tower using paper. They build their tower using paper and record the height of their tower. Students collect and record the heights of other towers and use that data to create a spreadsheet.
Curated OER
Central Tendencies and Normal Distribution Curve
Fourth graders are given data (class test scores) to determine central tendencies, and find information needed to construct a normal distribution curve. They become proficient in calculating mode, median and average.
Other popular searches
- Collecting and Recording Data
- Data Collection Techniques
- Math Lessons Data Collection
- Data Collection Activity
- Data Collection and Median
- Data Collection and Graphs
- Data Collection Projects
- Data Collection and Analysis
- Accurate Data Collection
- Data Collection Lesson Plans
- Experimental Data Collection
- Collection of Data


