Illustrative Mathematics
Weather Graph Data
Teaching young mathematicians about collecting and analyzing data allows for a variety of fun and engaging activities. Here, children observe the weather every day for a month, recording their observations in the form of a bar graph....
Illustrative Mathematics
Favorite Ice Cream Flavor
What better way to engage children in a math instructional activity than by talking about ice cream? Using a pocket chart or piece of chart paper, the class works together creating a bar graph of the their favorite ice cream flavors....
EngageNY
Summarizing Bivariate Categorical Data with Relative Frequencies
It is hard to determine whether there is a relationship with the categorical data, because the numbers are so different. Working with a familiar two-way table on super powers, the class determines relative frequencies for each cell and...
EngageNY
Understanding Variability When Estimating a Population Proportion
Estimate the proportion in a population using sampling. The 20th installment in a series of 25 introduces how to determine proportions of categorical data within a population. Groups take random samples from a bag of cubes to determine...
EngageNY
Random Sampling
Sample pennies to gain an understanding of their ages. The 16th installment of a 25-part series requires groups to collect samples from a jar of pennies. Pupils compare the distribution of their samples with the distribution of the...
EngageNY
Sampling Variability
Work it out — find the average time clients spend at a gym. Pupils use a table of random digits to collect a sample of times fitness buffs are working out. The scholars use their random sample to calculate an estimate of the mean of the...
EngageNY
Distributions and Their Shapes
What can we find out about the data from the way it is shaped? Looking at displays that are familiar from previous grades, the class forms meaningful conjectures based upon the context of the data. The introductory lesson to descriptive...
EngageNY
Developing a Statistical Project
The 17th lesson in a unit of 22 presents asks the class to conduct a statistics project. Pupils review the first two steps of the process of asking a question and collecting data. They then begin the process by developing a statistical...
Noyce Foundation
Granny’s Balloon Trip
Take flight with a fun activity focused on graphing data on a coordinate plane. As learners study the data for Granny's hot-air balloon trip, including the time of day and the distance of the balloon from the ground, they practice...
EngageNY
Connecting Graphical Representations and Numerical Summaries
Which graph belongs to which summary statistics? Class members build upon their knowledge of data displays and numerical summaries to connect the two. Pupils make connections between different graphical displays of the same data in the...
Virginia Department of Education
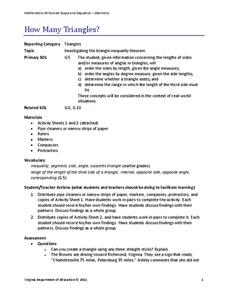
How Many Triangles?
Something for young mathematicians to remember: the sum of any two sides must be greater than the third. Class members investigates the Triangle Inequality Theorem to find the relationship between the sides of a triangle. At the same...
Curated OER
Music and Sports
With so much talent in the classroom, do your musicians and athletes have related interests? This problem has your learners taking data from their classmates to decide whether there is an association between the two activities. The...
Illustrative Mathematics
Tossing Cylinders
Everyone loves a activity that involves throwing things around! To understand probability, your experimenters will predict how different cylinder-shaped objects will land when tossed. When the data is collected, they will calculate the...
Illustrative Mathematics
How Many Buttons?
Bring the class into the probability by having everyone count buttons on their shirts. Organize the data into the chart provided and chose different possibilities such as "female with one button" or "all middle schoolers with more than...
EngageNY
Modeling Relationships with a Line
What linear equation will fit this data, and how close is it? Through discussion and partner work, young mathematicians learn the procedure to determine a regression line in order to make predictions from the data.
Achieve
BMI Calculations
Obesity is a worldwide concern. Using survey results, learners compare local BMI statistics to celebrity BMI statistics. Scholars create box plots of the data, make observations about the shape and spread of the data, and examine the...
Illustrative Mathematics
Buttons: Statistical Questions
Here is a nice activity about recognizing the difference between a statistical question and answer and one that anticipates a fixed answer. From this, your future statisticians will develop an understanding of variability and be able to...
Illustrative Mathematics
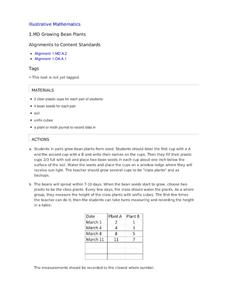
Growing Bean Plants
Plant growth experiments offer rich, cross-curricular learning opportunities that can really excite and engage young learners. In this series, children work in pairs planting, measuring, and comparing the height of bean plants in order...
Inside Mathematics
Graphs (2006)
When told to describe a line, do your pupils list its color, length, and which side is high or low? Use a worksheet that engages scholars to properly label line graphs. It then requests two applied reasoning answers.
EngageNY
Comparing Estimated Probabilities to Probabilities Predicted by a Model
Small groups devise a plan to find the bag that contains the larger percentage of blue chips. they then institute their plans and compare results to the actual quantities in the bags.
Beauty and Joy of Computing
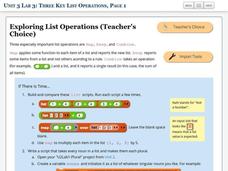
Three Key List Operations
Develop an understanding of the Map, Keep, and Combine operations. The lab leads the class through the exploration of three list operations. Each task contains a self-check to measure scholars' understanding of the operation in the task.


