Hi, what do you want to do?
Concord Consortium
Specific Heat and Latent Heat in Condensation
There's more to melting than meets the eye! Junior physical chemists investigate the differences between specific and latent heats as a substance undergoes a phase change. Users remove heat from the system and observe changes in kinetic...
McGraw Hill
Population Biology
The carrying capacity of an environment varies based on the organisms that live there. Using a virtual lab simulation, scholars test two protists living in their own environments and a third environment where both protists live....
Chemistry Collective
Virtual Lab: Unknown Acid and Base Problem
Looking for an easy way to give your class experience with acid-base chemistry outside the lab? Try a detailed interactive that puts them in total control! Young chemists determine the dissociation constant and concentration of an...
Curated OER
Think Science - Collecting Data
In this data collection worksheet, students collect data about butterflies and milkweed plants and record the measurement tools they use to collect it. Students complete 2 columns.
Learning Games Lab
The Magic of Reading Graphs
Making conclusions from graphs doesn't need to seem like magic. Learners explore an interactive lesson on reading graphs to strengthen their skills. The content discusses how to read the axes of a graph and draw conclusions based on the...
CK-12 Foundation
Single Bar Graphs: Hockey Teams
Raise the bar for hockey fans. Using data about favorite hockey teams, pupils build a bar graph. They use the information from the graph to make comparisons and solve one- and two-step problems.
Laboratory for Atmospheric and Space Physics
Science at 100,000 Feet
Take your class up, up, and away with an engaging weather balloon simulation! Individuals get hands-on experience in creating and launching their own airborne labs to study how temperature and pressure affect substances at 100,000...
Las Cumbres Observatory
Star In a Box
Stars may all look the same from down here, but their surfaces tell a different story. Using an animation, learners collect data about the temperature and luminosity of stars and compare them to their mass and radius. They then answer...
Shodor Education Foundation
Multiple Linear Regression
You'll have no regrets when you use the perfect lesson to teach regression! An interactive resource has individuals manipulate the slope and y-intercept of a line to match a set of data. Learners practice data sets with both positive and...
Shodor Education Foundation
Scatter Plot
What is the relationship between two variables? Groups work together to gather data on arm spans and height. Using the interactive, learners plot the bivariate data, labeling the axes and the graph. The resource allows scholars to create...
Curated OER
Among the Hidden - Population Math Activity
In this population instructional activity, learners collect data on population by researching the Census Bureau and then make online graphs and answer short answer questions about the data. Students complete 5 problems total.
Curated OER
My Test Book: Tally Charts
In this online interactive math activity, students solve 10 problems that require them to read and interpret tally chart data. Students may submit their answers to be scored.
Curated OER
Air Pollution:What's the Solution?-Weather's Role
In this air pollution and weather instructional activity, learners collect data using an online animation to determine the air quality at given times along with the wind speed and temperature in a particular city. Students make 3 bar...
American Museum of Natural History
Rising CO2! What Can We Do?
It is colorless and scentless, but it makes a large impact on the environment. Learners explore carbon dioxide emissions and what they mean for the environment using an interactive graph. They review changes over time and how they impact...
Curated OER
Elbow Room - Exploring Population Density
In this population worksheet, students click on the links and research the internet about population, land, and government. Students answer 16 short answer questions including making spreadsheets.
National Center for Ecological Analysis and Synthesis, University of California Santa Barbara
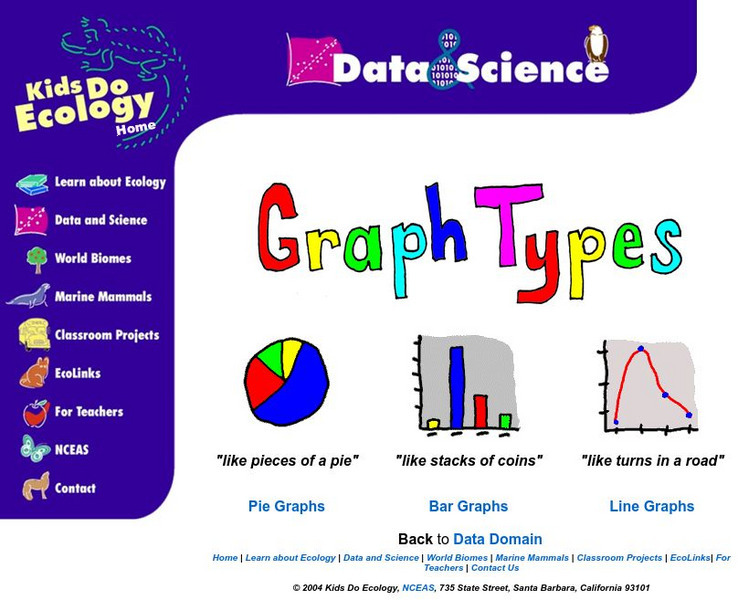
Nceas: Graph Types
At this site from NCEAS you can learn how to organize your data into pie graphs, bar graphs, and line graphs. Explanations and examples are given of each graph along with several questions that check comprehension.
PBS
Pbs Kids: Curious George: Hat Grab
This Curious George game teaches children data analysis and graphing. Grab hats as people pass by so that George can graph the collected hats. Then answer a question about the hats!
US Department of Education
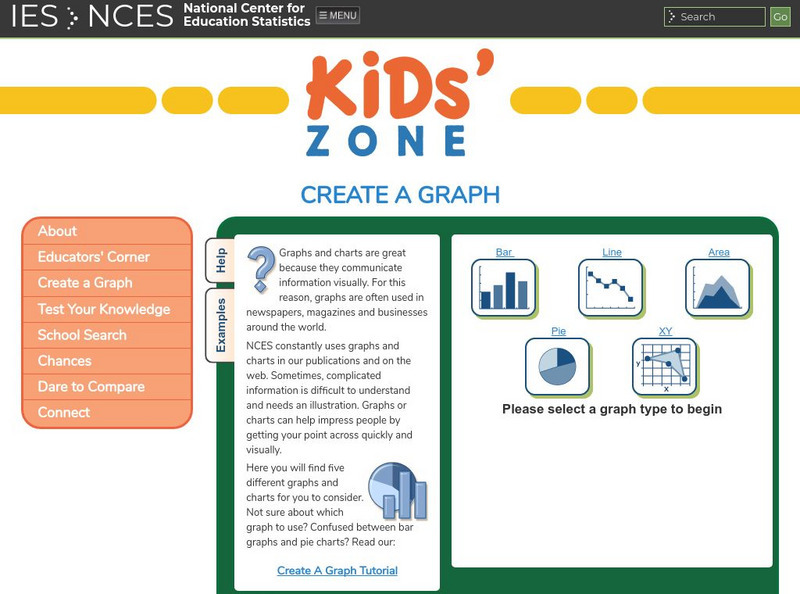
Nces Kids: Create an Xy Graph
This is where you can find a step by step explanation of how to create an XY graph. When you finish each step just click the next tab and you will find the next set of instructions.
US Department of Education
Nces Kids: Creating an Area Graph
This is where you will find step by step directions explaining how to create an area graph. Complete each step and click on the next tab. Directions are simple and clear.
Physics Aviary
Physics Aviary: Graphing Motion Lab
This lab was designed to generate some data that students can use when learning about simple graphing motion. Students will track the motion of a row boat as it moves through a course and then they will create a graph of the data that...
Physics Aviary
Physics Aviary: Graphing Motion Lab 2
This lab was designed to generate some data that students can use when learning about two stage graphing motion. Students will track the motion of a dragster as it accelerates and then moves at a constant speed and then they will create...
National Center for Ecological Analysis and Synthesis, University of California Santa Barbara
Nceas: What Are Data?
This site from NCEAS answers many questions about data. You can also learn about data, tables, and types of graphs in this informative site.
Concord Consortium
Concord Consortium: Stem Resources: Seeing Motion
With this interactive tool and the use of a motion sensor, students will track their own motion and, as they collect data in several experiments, they will plot it on a distance-time graph. After completing the three experiments, they...
TeacherLED
Teacher Led Interactive Whiteboard Resource Survey
Students can explore surveys, pie charts, and bar graphs with this interactive white board resource.


