NASA
Global Air Temperatures Graph: Student Activity
Analyze years of hard climate change evidence in minutes. Climatologists evaluate graphical data about climate change by answering questions. Scientists work collaboratively using a literacy cube or virtual die that directs them through...
Teach Engineering
Breaking the Mold
A little too much strain could cause a lot of stress. Groups conduct a strength test on clay. Using books as weights, pupils measure the compression of clay columns and calculate the associated strain and stress. Teams record their...
Howard Hughes Medical Institute
Tracking Genetically Modified Mosquitoes
What's that buzzing in your ear? An insightful lesson about genetically modified mosquitoes! Partnered pupils explore the creation, release, and monitoring of mosquitoes designed to reduce the mosquito population. After watching a video,...
What happened to the frogs?
Students will select ten rubber frogs and determine their pollutant source based on their malformations. Students will write a brief essay on their findings. Students will be engaged in the lesson the entire time!
Math Is Fun
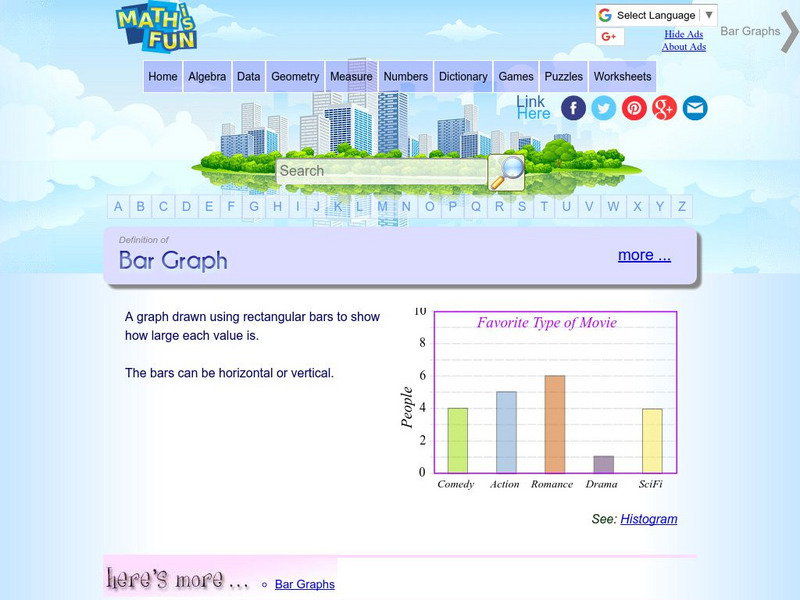
Math Is Fun: Definition of Bar Graph
Get the definition for a bar graph. Then, select the link "here's more" and use the interactive graph to display data as a bar graph, line graph or pie chart. The finished graph may be printed.
TeachEngineering
Teach Engineering: Applying Hooke's Law to Cancer Detection
Students explore Hooke's law while working in small groups at their lab benches. They collect displacement data for springs with unknown spring constants, k, by adding various masses of known weight. After exploring Hooke's law and...


