National Wildlife Federation
The Tide is High, but I’m Holding On… Using ICESat Data to Investigate Sea Level Rise
Based on the rate of melting observed from 2003-2007 in Greenland, it would take less than 10 minutes to fill the Dallas Cowboys' Stadium. The 17th lesson in a series of 21 has scholars use the ICESat data to understand the ice mass...
Curated OER
On the Trail of the Hudson's Migratory Fish
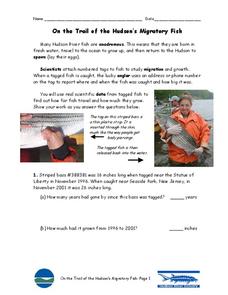
Ever wonder how scientists track fish underwater? Your class can learn how with this informative worksheet. First, they will read a paragraph about androgynous fish, tagging, and data analysis. Then, your scientists must answer five...
NOAA
Ground-truthing Satellite Imagery with Drifting Buoy Data
Ground-truthing ... is it even a word? The last installment of a five-part series analyzes how scientists collect sea surface temperature data. Scholars use government websites to compare temperature data collected directly from buoys...
Curated OER
Water Meter Reader
Junior high schoolers learn how to read a water meter, track their family water usage, and discuss the amount in class with other pupils. They will interpret real-world data and graph it. It is ideal for increasing awareness and...
Curated OER
Great Lakes Snow Analysis Collaborative Network
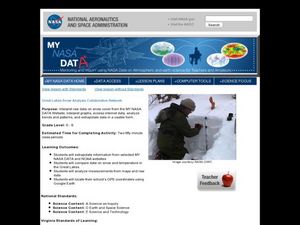
Learners interpret data on snow cover and analyze trend patterns. In this snow instructional activity students compare data and locate their school's GPS coordinates.
Curated OER
"Lettuce" Learn About the Water Cycle
Young scientists investigate the water cycle through a lettuce seed experiment. For this experiment, learners plant lettuce seeds inside of a ziplock bag in order to create a small greenhouse. They observe condensation and precipitation,...
Curated OER
Forest Fires
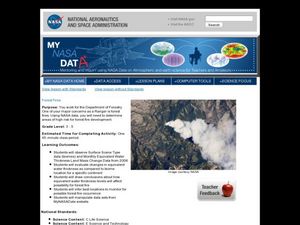
Students play the role of a Ranger with the Department of Forestry. In this forest fires instructional activity, students examine data on biomes and images to determine high risk areas for forest fires to develop.
University of Georgia
Freezing and Melting of Water
Examine the behavior of energy as water freezes and melts. An engaging activity provides a hands-on experience to learners. Collaborative groups collect data and analyze the graphs of the temperature of water as it freezes and then...
Curated OER
Getting the Lead Out
The article for this lesson no longer accessible through the links in the lesson plan, but can be found in the National Center for Biotechnology Information website. After reading it, environmental science students answer questions and...
Curated OER
Water Resources
High schoolers study water resources that are important to the people of North American and Africa. They use satellite images and data to explore how human actions can degrade, improve, or maintain water resources. They analyze and...
Curated OER
Water in the Geosphere
Through a PowerPoint presentation and the embedded animation and video, earth science enthusiasts find out about the moisture in the soil beneath our feet. In the animation, follow a water molecule on its path through the water cycle. As...
Foundation for Water & Energy Education
How is Flowing Water an Energy Source? Activity B
Explore the world's water without leaving the classroom! In this second of three uncomplicated but wonderful activities, physical science learners feel the pressure of water. They discover that the deeper the water, the stronger the...
Science 4 Inquiry
A Whole New World: The Search for Water
Scholars find Earth won't support humans much longer and need to identify a planet with water to inhabit. They test four unknown samples and determine which is the closest to water. Then they explain and defend their results.
Curated OER
Explore Surface Types on a Journey Around Earth
Young scholars explore satellite data. In this technology cross-curriculum math and world geography lesson, students locate specific map areas using a microset of satellite data. Young scholars use technology and math skills to determine...
Curated OER
Raw Seafood ~ On the Half Shell
The topic is fascinating, but there is not much for learners to do here. Food borne illness has always been a problem for humans to face, and here, data from the Center for Disease Control is analyzed. Learners look at the number of...
Curated OER
How Does Water Cool?
How fast does water cool? First fifth graders will draw a line on a graph that predicts how fast they think water can cool from boiling. Then they plot the actual data on the same graph to see if their estimate was correct.
Curated OER
Ecosystems and Remote Sensing
Young scholars obtain remote sensing data to compare and contrast global biomass data with global temperature data.
Chicago Botanic Garden
Historical Climate Cycles
What better way to make predictions about future weather and climate patterns than with actual climate data from the past? Young climatologists analyze data from 400,000 to 10,000 years ago to determine if climate has changed over time....
Curated OER
Water in the Atmosphere
A slide show serves as the backdrop for a lesson on the moisture in Earth's atmosphere. Through it, mini meteorologists learn about the attributes of the atmosphere and actually use data-collecting weather tools to make observations and...
Curated OER
Water Conservation
Open learners' eyes to the challenge of finding safe drinking water – something we often take for granted in our country. The PowerPoint presentation includes images, graphs, diagrams, and even a video to stimulate discussion on how we...
Curated OER
Organizing Data
In this organizing data instructional activity, 7th graders solve seven different types of problems related to data. They first identify the type of data as categorical, discrete or continuous from the information given. Then, students...
Curated OER
Cold, Clouds, and Snowflakes
Students explore satellite data and graphing. In this weather data analysis math and science lesson, students analyze NASA satellite data to draw conclusions about geographical areas where precipitation might have happened. Students...
Curated OER
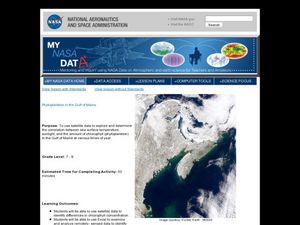
Phytoplankton in the Gulf of Maine
Students use satellite data to see the correlation between sea temperature and sunlight in the Gulf of Maine. In this phytoplankton lesson students use Excel to analyze data.
Learning Games Lab
Water Sampling
Scientific procedures ensure valid data and valid results. Use a water sampling interactive to teach learners the procedures for collecting water samples. The interactive takes users through the process step-by-step with notes of...


