Scholastic
Study Jams! Line Plots
Data analysts are guided through the arrangement of whole-number data onto a line plot by listening and viewing a high-quality, animated, and narrated set of slides.
Q Continuum
Planets
Have you ever looked up at the night sky and wondered what constellation you were seeing or whether that bright object was a star or a planet? Are you searching for the best tilt-to-view constellation and planet app that money can't buy?...
Baylor College
HIV/AIDS in the United States
In the final of five lessons about HIV/AIDS, groups create presentations to share data about the infection rates in the United States, examining demographic and geographic trends over the past ten years. Depending on how much time you...
Curated OER
Mystery Jars
This is a twist on the old "guess how many jellybeans" game. Using estimation and math skills, learners participate in a fun "mystery jars" activity, trying to make educated guesses at how many objects are in two jars. The basic activity...
CK-12 Foundation
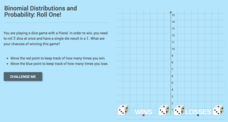
Binomial Distributions and Probability: Roll One!
It takes exactly one to win. Pupils calculate the probability of rolling five dice and having only a single die come up with a one. Learners calculate the number of expected wins out of a series of games. The interactive provides...
CK-12 Foundation
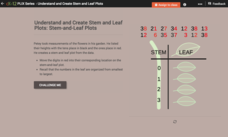
Understand and Create Stem-and-Leaf Plots: Stem-and-Leaf Plots
Explore the advantages to using a stem-and-leaf plot using an online lesson. Learners manipulate an animation to create a stem-and-leaf plot. They then calculate statistics for the data using their display. Guiding questions help them...
Cornell University
Celebrate Urban Birds
Set up a 50x50 square foot area in a space at school and choose three days to go outside and observe the birds seen in a 10 minute span. The activity has learners tapping into their observation skills and creates awareness of the birds...
National Endowment for the Humanities
African-American Communities in the North Before the Civil War
Middle schoolers may be surprised to learn that before the American Civil War there were more slaves living in New York than there were in Kentucky! Young historians examine maps and census data to gather statistics about...
BioEd Online
Good Stress for Your Body
Stress the importance of the different types of pressure our mind and body experience in a lesson about how certain types of stress are actually necessary and good for our bodies. As astronauts and people with injuries can attest, not...
Curated OER
How Does Your Garden Grow? Discovering How Weather Patterns Affect Natural Cycles
For the warm-up in this cool climate lesson, you will need to click on "Mapping" and then "US Mapping" once you arrive at NOAA's "US Climate at a Glance" page. Earth science explorers realize that 2012 was a warm winter for us. They read...
Baylor College
Gravity and Muscles
Humans are so used to gravity as a force that we don't tend to pay much attention to it on a daily basis. Through a couple simple activities, learners experience changes to their center of gravity and come to the understanding that...
Sea World
Seals, Sea Lions, and Walruses
Learn about the mammals of the sea with a lesson about seals, sea lions, and walruses. Kids study the characteristics of each pinniped with flash cards and information, and then analyze data about elephant seals, measure heat loss in...
Computer Science Unplugged
Lightest and Heaviest—Sorting Algorithms
How do computers sort data lists? Using eight unknown weights and a balance scale, groups determine the order of the weights from lightest to heaviest. A second worksheet provides the groups with other methods to order the weights. The...
Curated OER
Lessons for Atlatl Users with Some Experience-Grade 6
Sixth graders experiment with an atlatl and dart. In this sixth grade data management mathematics lesson, 6th graders explore and determine the most suitable methods of displaying data collected from their experimentation with throwing...
Curated OER
Mathematics and Environmental Concerns
Young scholars gather data and analyze behaviors regarding recycling. In this environmental concerns unit, students discus and examine reuse, recycle, and reduce. Young scholars collect, graph, and display data associated with four...
Curated OER
Pizza, Pizza
Students survey community members to determine their favorite pizza toppings and create a bar graph to show their findings. In this probability and statistics instructional activity, students collect data by conducting a survey. They...
Curated OER
Learning to Interview
Second graders watch simulated interview between the teacher and a student before they interview a classmate using the form provided. Next, they complete two interviews of family members at home. They focus on the concepts of ancestors...
Curated OER
Monk Seal Research Expedition
Students study data. In this seal research lesson, students act as scientific researchers observing Monk seals in their habitat. They work in small groups to record data from a video and when through they share a piece of information...
Curated OER
Gathering, Recording, and Presenting Data
Sixth graders use the local newspaper to find and discuss examples of uses of statistics and the ways in which the information is presented. They create and represent their own set of data showing how students get to school each day.
Curated OER
I Can Average Grades Like My Teacher!!!
Fifth graders investigate the mean of a data set. In this fifth grade mathematics instructional activity, 5th graders determine the mean of sets of numbers using a calculator. Students use a blank role book page to create grades for...
Curated OER
Mean, Mode and Bar Graphs
In this mean, mode and bar graphs worksheet, 5th graders analyze the data given, then answer three questions about a bar graph and the data shown.
Curated OER
Misleading Graphs
Students explore number relationships by participating in a data collection activity. In this statistics lesson, students participate in a role-play activitiy in which they own a scrap material storefront that must replenish its stock....
Curated OER
Exploring the USA and the World with Cartograms
Young scholars investigate cartograms in order to explore the different countries on Earth. In this world geography lesson, students use the Internet to analyze data on different cartograms. Young scholars compare data, such as...
Curated OER
Learning to Make Bar Graphs
Students construct bar graphs using the results from various experiments. In this graphing lesson, students review data from a previous experiment and demonstrate how to construct a bar graph. Students use a checklist to ensure...
Other popular searches
- Data Sets Data Collection
- Linear Data Sets
- Comparing Two Data Sets
- Quadratic Data Sets
- Data Sets and Graphs
- Compare Related Data Sets
- Experiments and Data Sets
- Correlation of Data Sets
- Create Data Sets
- Circle Graph Data Set
- Compare Data Sets
- Compare Two Sets of Data


