Curated OER
Canada's Climate: Temperature and Rainfall Variations
Middle schoolers analyze data about various climates in Canada. In this data analysis and climate lesson, students use Canada Year Book 1999 to complete a worksheet and make connections between precipitation and temperature in different...
Curated OER
How Creepy!
Students observe and measure a model of slow down slope movement. In this graphing instructional activity students collect, record, and organize data that apply to models.
Illustrative Mathematics
Rolling Dice
Rolling dice is a great way for your mathematicians to get a hands-on approach to probabilities. Use the chart to record whether they rolled a six during ten attempts. Calculate results individually (or in small groups) and then record...
Curated OER
Looking for More Clues
Fifth graders explore how to collect data and display it on a bar and circle graph.
Curated OER
Designing a Study
Students explore features to consider when designing a scientific study. In this science research lesson, students examine different methods of data collection and consider which method would be appropriate for determining how many types...
Curated OER
Ramp Builder
Students plan and build a ramp designed for maximum distance a car can travel. In this physics and data collection math lesson, students work in groups to design a ramp using various household materials. Students test small cars on their...
Curated OER
Representing Data 2: Using Box Plots
What information can be gleaned from a box and whiskers plot? Discuss the five summary values - minimum, maximum, upper and lower quartiles, and median - and what conclusions can be made from these values? Included here is a matching...
Curated OER
The Power of Graphical Display: How to Use Graphs to Justify a Position, Prove a Point, or Mislead the Viewer
Analyze different types of graphs with learners. They conduct a survey and determine the mean, median and mode. They then identify different techniques for collecting data.
Curated OER
Voter Turnout
Explore politics by analyzing the voting process. Pupils discuss the purpose of casting votes in an election, then examine graphs based on the data from a previously held election's turnout. The lesson concludes as they answer study...
Curated OER
Exploring Quadratic Data : Transformation Graphing
High schoolers analyze the vertex form of a parabola and find an approximate fit of a model. They explain the quadratic parabola function and its properties by developing quadratic models. They use translation and dilation to change the...
University of Colorado
Using Spectral Data to Explore Saturn and Titan
Saturn's rings are made of dust, ice, and solid chunks of material. Individuals use spectrographs in this final installment of 22 lessons to determine the atmospheric elements. They analyze spectrums from Titan's atmosphere and Saturn's...
Shodor Education Foundation
Multi-Function Data Flyer
Explore different types of functions using an interactive lesson. Learners enter functions and view the accompanying graphs. They can choose to show key features or adjust the scale of the graph.
Corbett Maths
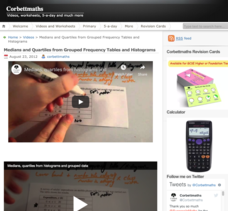
Medians and Quartiles from Grouped Frequency Tables and Histograms
Determine medians within a group. Given data represented as a frequency table of grouped data, the video demonstrates finding an estimation for the median. After finding the group where the median resides, the presenter uses a formula to...
PBS
Stereotypes vs. Statistics (Grades 9-12)
What is a common stereotype people may think about you; is it true? Using a thought-provoking lesson, high schoolers analyze common stereotypes of the Latino-American population versus statistical data. Scholars review data and have the...
Curated OER
Mean, Median, and Mode
Show scholars the three ways to find an average: mean, median, and mode. They reference a guided example before doing these on their own. There are three sets of data and learners find the three averages for each. All answers and data...
Education Development Center
Creating a Polynomial Function to Fit a Table
Discover relationships between linear and nonlinear functions. Initially, a set of data seems linear, but upon further exploration, pupils realize the data can model an infinite number of functions. Scholars use multiple representations...
PBL Pathways
Total Cost to Produce the Turbo Blender
Class members blend their knowledge of functions and problem-solving skills to provide business advice to the Turbo Blender manufacturers. Through a project-based approach, learners examine marginal cost data to produce a function. They...
Balanced Assessment
Monitor Pricing
Out with the old and in with the new. Learners use a set of prices of computer monitors from 1994 to make a prediction. They then use one current price and what they know about the old prices to make a more recent prediction. Their...
Curated OER
Go Fish!
So much science in one tiny fish! Introduce young biologists to the zebrafish, a common aquarium inhabitant. The small, unassuming organism presents an opportunity for learners to study habituation using an easy-to-care-for species. Lab...
EngageNY
Differences Due to Random Assignment Alone
It takes a lot of planning to achieve a random result! Learners compare results of random assignment, and conclude that random assignment allows results to be attributed to chance. They also realize the set of random means are clustered...
Shodor Education Foundation
Sequencer
Take the first step into graphing sequences. Learners set the starting number, multiplier, add-on, and the number of steps for a sequence. Using the inputs, the interactive calculates and plots the sequence on the coordinate plane. Users...
Curated OER
Averages: Mean, Median, Mode
After reviewing the process of finding the mean, median, mode, and average of a given data set, learners work through several practice problems. There are five problems related to mode, and five related to finding the mean. Great as...
Curated OER
Collecting My School Family Data
Students are tasked with collecting data on their school. In groups, they collect data on various aspects of school life along with social and economic backgrounds and charactertics of their hair and eye color. They draw two pictures,...
Curated OER
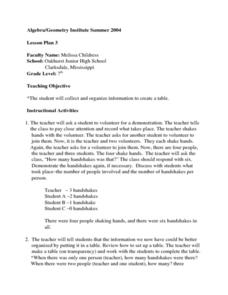
Creating a Data Table
Seventh graders explore organizing data into a table. The teacher leads a handshaking activity among the class. They collect the information concerning the number of handshakes each person received. Students discover a pattern. They...
Other popular searches
- Data Sets Data Collection
- Linear Data Sets
- Comparing Two Data Sets
- Quadratic Data Sets
- Data Sets and Graphs
- Compare Related Data Sets
- Experiments and Data Sets
- Correlation of Data Sets
- Create Data Sets
- Circle Graph Data Set
- Compare Data Sets
- Compare Two Sets of Data


