Curated OER
The Orbit Of Planet Gamma
Students investigate the concept of common errors that are made in the laboratory setting while analyzing the data of an experiment. They are given a scenario and are asked to measure the data of the major and minor axis. The purpose is...
Curated OER
Graphs
Students graph ordered pairs to model the relationship between numbers. After observing the patterns in ordered pairs, they describe the relationship, and create graphs from a data table. Students describe intervals in the graph, and...
Curated OER
Discovering Demographics
Pupils analyze demographic data including a statistical overview of India. Students synthesize their findings and create an informational poster about India.
Curated OER
Society, Cyberspace and the Future
Students locate information on the rapid growth of world population and consumption needs through the use of Internet, Cd-ROMs, laser dics and other media. They use spreadsheet to present data gathered on world population growth between...
Curated OER
TRB 3:4 - Investigation 2 - Jump
Third graders jump with and without weights to reveal data that gravity has more of a pulling force with heavy objects that are on the ground than light objects on the ground. They also identify how their legs felt when they jumped with...
Curated OER
Bar Graphs With Intervals
Give your math class a comprehensive understanding of bar graphs with this series of lessons. The resource is divided into three parts, and all of the accompanying worksheets are included. The class will study different bar graphs,...
Curated OER
Safety Comes First
Here is a thorough lesson on safety in the chemistry lab. Chemists review a detailed list of safety rules, draw the layout of the laboratory area to include emergency equipment, identify hazard warnings, and consult the MSDS in order to...
Scholastic
A Reading Guide to A Wrinkle in Time
Accompany a reading of Madeleine L'Engle's classic tale, A Wrinkle in Time, with a detailed guide equipped with 15 informative and useful chapters. Scholars discover who the author is, why she wrote the book, and crucial story elements...
Curated OER
The Effect of Dissolved Salt on the Boiling Point of Water
Explore the properties of solutions with a lab activity. Chemistry fans determine the boiling point of water, add salt to create a solution, and then repeat the process four more times. They design their own data table and then graph the...
Curated OER
A Solubility Curve for Potassium Nitrate
Step-by-step laboratory instructions are listed so that chemistry explorers can consider the solubility of potassium nitrate. They combine their results with those of other lab groups and then graph the data to display the solubility...
Curated OER
Common Core State Standards 1st Grade Math
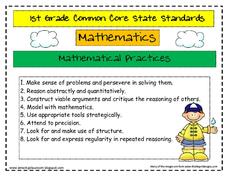
Here are the complete set of the math practice standards and the Common Core standards for first grade. They cover operations & algebraic thinking, operations in base 10, measurement and data, and geometry. Illustrated nicely with...
American Chemical Society
Evaporation
This is one in several lessons that explore the relationship between temperature and phase changes of water. After some discussion, elementary physical scientists place wet paper toweling on a hot and a room-temperature water bag and...
Kenan Fellows
Lego Thinking and Building
Run a simulated airplane manufacturing plant with your pupils as the builders! Learners build Lego airplane models and collect data on the rate of production, comparing the number produced to the number defective. Using linear...
Virginia Department of Education
Curve of Best Fit
Which function models the data best? Pupils work through several activities to model data with a variety of functions. Individuals begin by reviewing the shapes of the functions and finding functions that will fit plotted data points. By...
Curated OER
Super Ticket Sales
Use this graphing data using box and whisker plots lesson to have learners make box and whisker plots about ticket sales of popular movies. They find the mean, median, and mode of the data. Pupils compare ticket sales of the opening...
Curated OER
Time That Period
Physical science starters play with a pendulum in order to experience periodicity. Detailed procedures and a worksheet are included for day one. For day two, learners will use a graphing calculator to help them plot orbit data from a...
Texas Instruments
Finding Linear Models Part III
Explore linear functions! In this Algebra I lesson, mathematicians graph data in a scatter plot and use a graphing calculator to find a linear regression and/or a median-median line. They use the model to make predictions.
Curated OER
Ice Cream
Students explore the concepts of mean, median, mode, and range as they elicit data about people's favorite flavor of ice cream. A practical application of the data obtained offers an extension to the lesson plan.
Curated OER
Stars and Slopes
More of a math lesson plan than physics or space science, high schoolers take a set of data and plot it on a log-log coordinate system. The write-up for day two was never completed, but day one, "Stars and Slopes," is complex and...
Polar Trec
Temperature Profile above the South Pole
Collecting and understanding data is a big part of understanding the world and how it changes. To better grasp what temperatures are changing and how they affect global populations, learners create a graph based on the date provided....
Buffalo-Hanover Montrose Schools
Histogram Worksheet
Young mathematicians analyze a given set of numbers to complete a frequency table, and then make a histogram using the data. The worksheet includes three sets of data on the worksheet.
Curated OER
Questioning NASA
Space science and math collide in this inquiry that investigates launching times for antacid-tablet rockets! Upper elementary or middle school learners collect data as they launch these mini rockets. They apply concepts of place value...
Statistics Education Web
Double Stuffed?
True or false — Double Stuf Oreos always contain twice as much cream as regular Oreos. Scholars first measure the masses of the filling in regular Oreos and Double Stuf Oreos to generate a class set of data. They use hypothesis testing...
University of Colorado
The Moons of Jupiter
Middle schoolers analyze given data on density and diameter of objects in space by graphing the data and then discussing their findings. This ninth installment of a 22-part series emphasizes the Galilean moons as compared to other objects.
Other popular searches
- Data Sets Data Collection
- Linear Data Sets
- Comparing Two Data Sets
- Quadratic Data Sets
- Data Sets and Graphs
- Compare Related Data Sets
- Experiments and Data Sets
- Correlation of Data Sets
- Create Data Sets
- Compare Data Sets
- Compare Two Sets of Data
- Comparing Sets of Data


